Unveiling the Secrets of eBPF+Ftrace: 'no space left on device'?
This article can be found at: https://www.ebpf.top/post/no_space_left_on_devices
Recently, there have been cases of failures in creating containers with the error “no space left on device” in the production environment. However, during the investigation, it was found that disk space and inodes were quite normal. In cases where conventional troubleshooting methods have failed, is there a quick and universal approach to pinpointing the root cause of the problem?
This article records the analysis and troubleshooting process using eBPF + Ftrace in a separate environment. Considering the general applicability of this approach, it has been organized in the hope of serving as a stepping stone for further exploration.
The author’s expertise is limited, and the ideas presented are for reference only. There may be some shortcomings in judgment or assumptions, so feedback and corrections from experts are welcome.
1. Understanding “no space left on device” Error
The method to replicate locally may not be entirely consistent with the root cause of the issue in the production environment and is intended for learning purposes.
When running docker run on a machine, the system displays “no space left on device,” resulting in container creation failure:
|
|
The error message indicates insufficient disk space during overlay mount. Checking the disk space situation using the df -Th command shows:
|
|
However, the disk space usage reveals that the overlay device mounted in the system is only 46% utilized. Based on some troubleshooting experience, I recall that depletion of inodes in the file system could also lead to this situation. Checking the inode capacity using df -i:
|
|
From the inode situation, the inode usage in the overlay file system is only 7%. Could it be possible that files were deleted but their handles were not released, causing a delayed release and handle leak? Out of desperation, I used lsof | grep deleted to look for clues but found none:
|
|
After attempting common error scenarios without success, the problem seems to have reached an impasse. In situations where conventional troubleshooting methods fail, is there a way for troubleshooters to identify issues without overly relying on kernel experts?
Indeed, there is. Today, the spotlight belongs to ftrace and eBPF (tools developed based on eBPF technology, such as BCC).
2. Problem Analysis and Localization
2.1 Preliminary Identification of Problematic Function
The conventional way to analyze is to step by step through the client-side source code, but in container architecture, it involves a series of links like Docker -> Dockerd -> Containerd -> Runc, making the analysis process slightly cumbersome, requiring some expertise in container architecture.
Therefore, we can quickly identify issues by using the error codes from system calls. This method requires some experience and luck. If there is enough time, it is still recommended to gradually locate and analyze the source code, as it helps troubleshoot problems and allows for deeper learning.
The error “no space left on device” is defined in the kernel include/uapi/asm-generic/errno-base.h file as follows:
Generally, you can search directly in the kernel using the error message.
|
|
BPF provides a system call tracing tool syscount-bpfcc for filtering based on error codes. The tool also offers the -x option to filter failed system calls, which is very useful in many scenarios.
Please note that the suffix bpfcc in syscount-bpfcc is specific to Ubuntu systems, whereas the source code in the BCC tool is known as syscount.
First, let’s briefly understand how to use the syscount-bpfcc tool:
|
|
In the syscount-bpfcc parameters, we can use the -e option to specify filtering based on the return of the ENOSPEC error in the system call:
|
|
The trace result shows that the system call mount returned the ENOSPEC error.
To determine the calling program of the mount system call that caused the error, we can use the “-P” parameter to aggregate and display by process:
|
|
The trace result indicates that the mount system call invoked by the dockerd background process returned the ENOSPEC error.
To track specific processes, you can use the -p parameter to trace a process ID, useful when focusing on a specific process for investigation. If interested in viewing related code implementations, you can add the –ebpf parameter to print the relevant source code after the command syscount-bpfcc -e ENOSPC -p 3010 --ebpf.
With the help of the syscount-bpfcc tool, we have preliminarily identified that the dockerd system call mount returned the ENOSPC error.
The mount system call is sys_mount, but in newer kernel versions, the sys_mount function is not a direct entry point for tracing. This is because the 4.17 kernel made adjustments to system calls and added corresponding architectures on different platforms. For more details, refer to new BPF APIs to get kernel syscall entry func name/prefix.
In Ubuntu 21.10 with the 5.13.0 kernel and ARM64 architecture, the actual kernel entry function for sys_mount is __arm64_sys_mount:
For x86_64 architecture, the corresponding function for sys_mount is
__x64_sys_mount, while other architectures can be confirmed by searching in/proc/kallsyms.
Up to this point, we have identified the kernel entry function __arm64_sys_mount, but how do we locate where exactly the error occurred in the sub-call process? After all, the function call path in the kernel is quite long and may involve various jumps or specific implementations.To identify the erroneous subprocess, the first step is to obtain the subprocess called by __arm64_sys_mount. The function_graph tracer in ftrace can be very helpful. In this article, I directly use the frontend tool funcgraph from the project perf-tools, which completely avoids manually setting various tracing options.
If you are not familiar with ftrace, it is recommended to learn more about Ftrace Essentials later on.
2.2 Locating the Root Cause of the Issue
The funcgraph function in the perf-tools toolkit can be used to directly trace the calling subprocess of kernel functions. The usage of funcgraph tool is as follows:
|
|
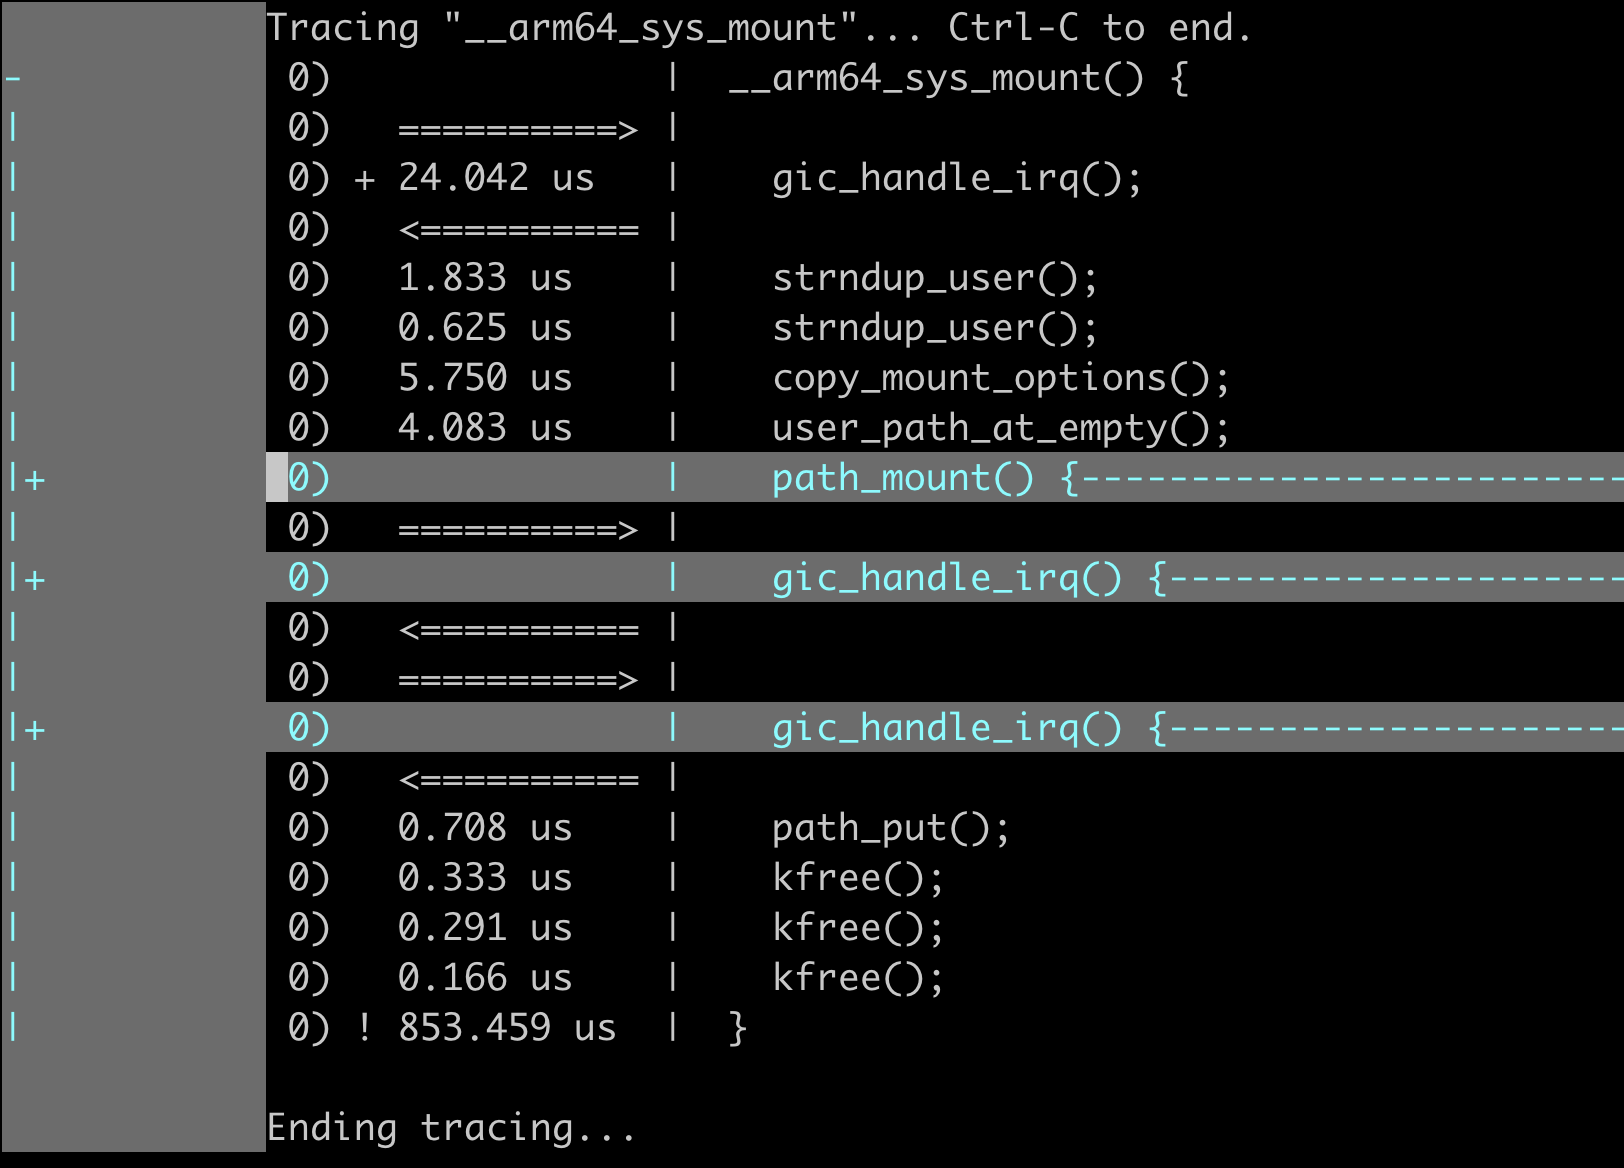
For the first use, I set the depth of tracing subprocess to 2 using the parameter -m 2 to avoid viewing function calls too deeply at once.
|
|
To fold the trace results in vim, you can refer to the corresponding section in Ftrace Essentials.
The function
gic_handle_irq()seems to be related to interrupt handling, which can be ignored.
By analyzing the funcgraph tracing results, we can obtain the key subprocess functions called within the __arm64_sys_mount function.
During the kernel function calls, if an error occurs, it usually directly jumps to the error-related cleanup function logic (without calling subsequent subprocesses). Here, we can shift our focus from the __arm64_sys_mount function to analyze the critical path_mount kernel function towards the end.
For a deeper analysis of the path_mount function calls:
|
|
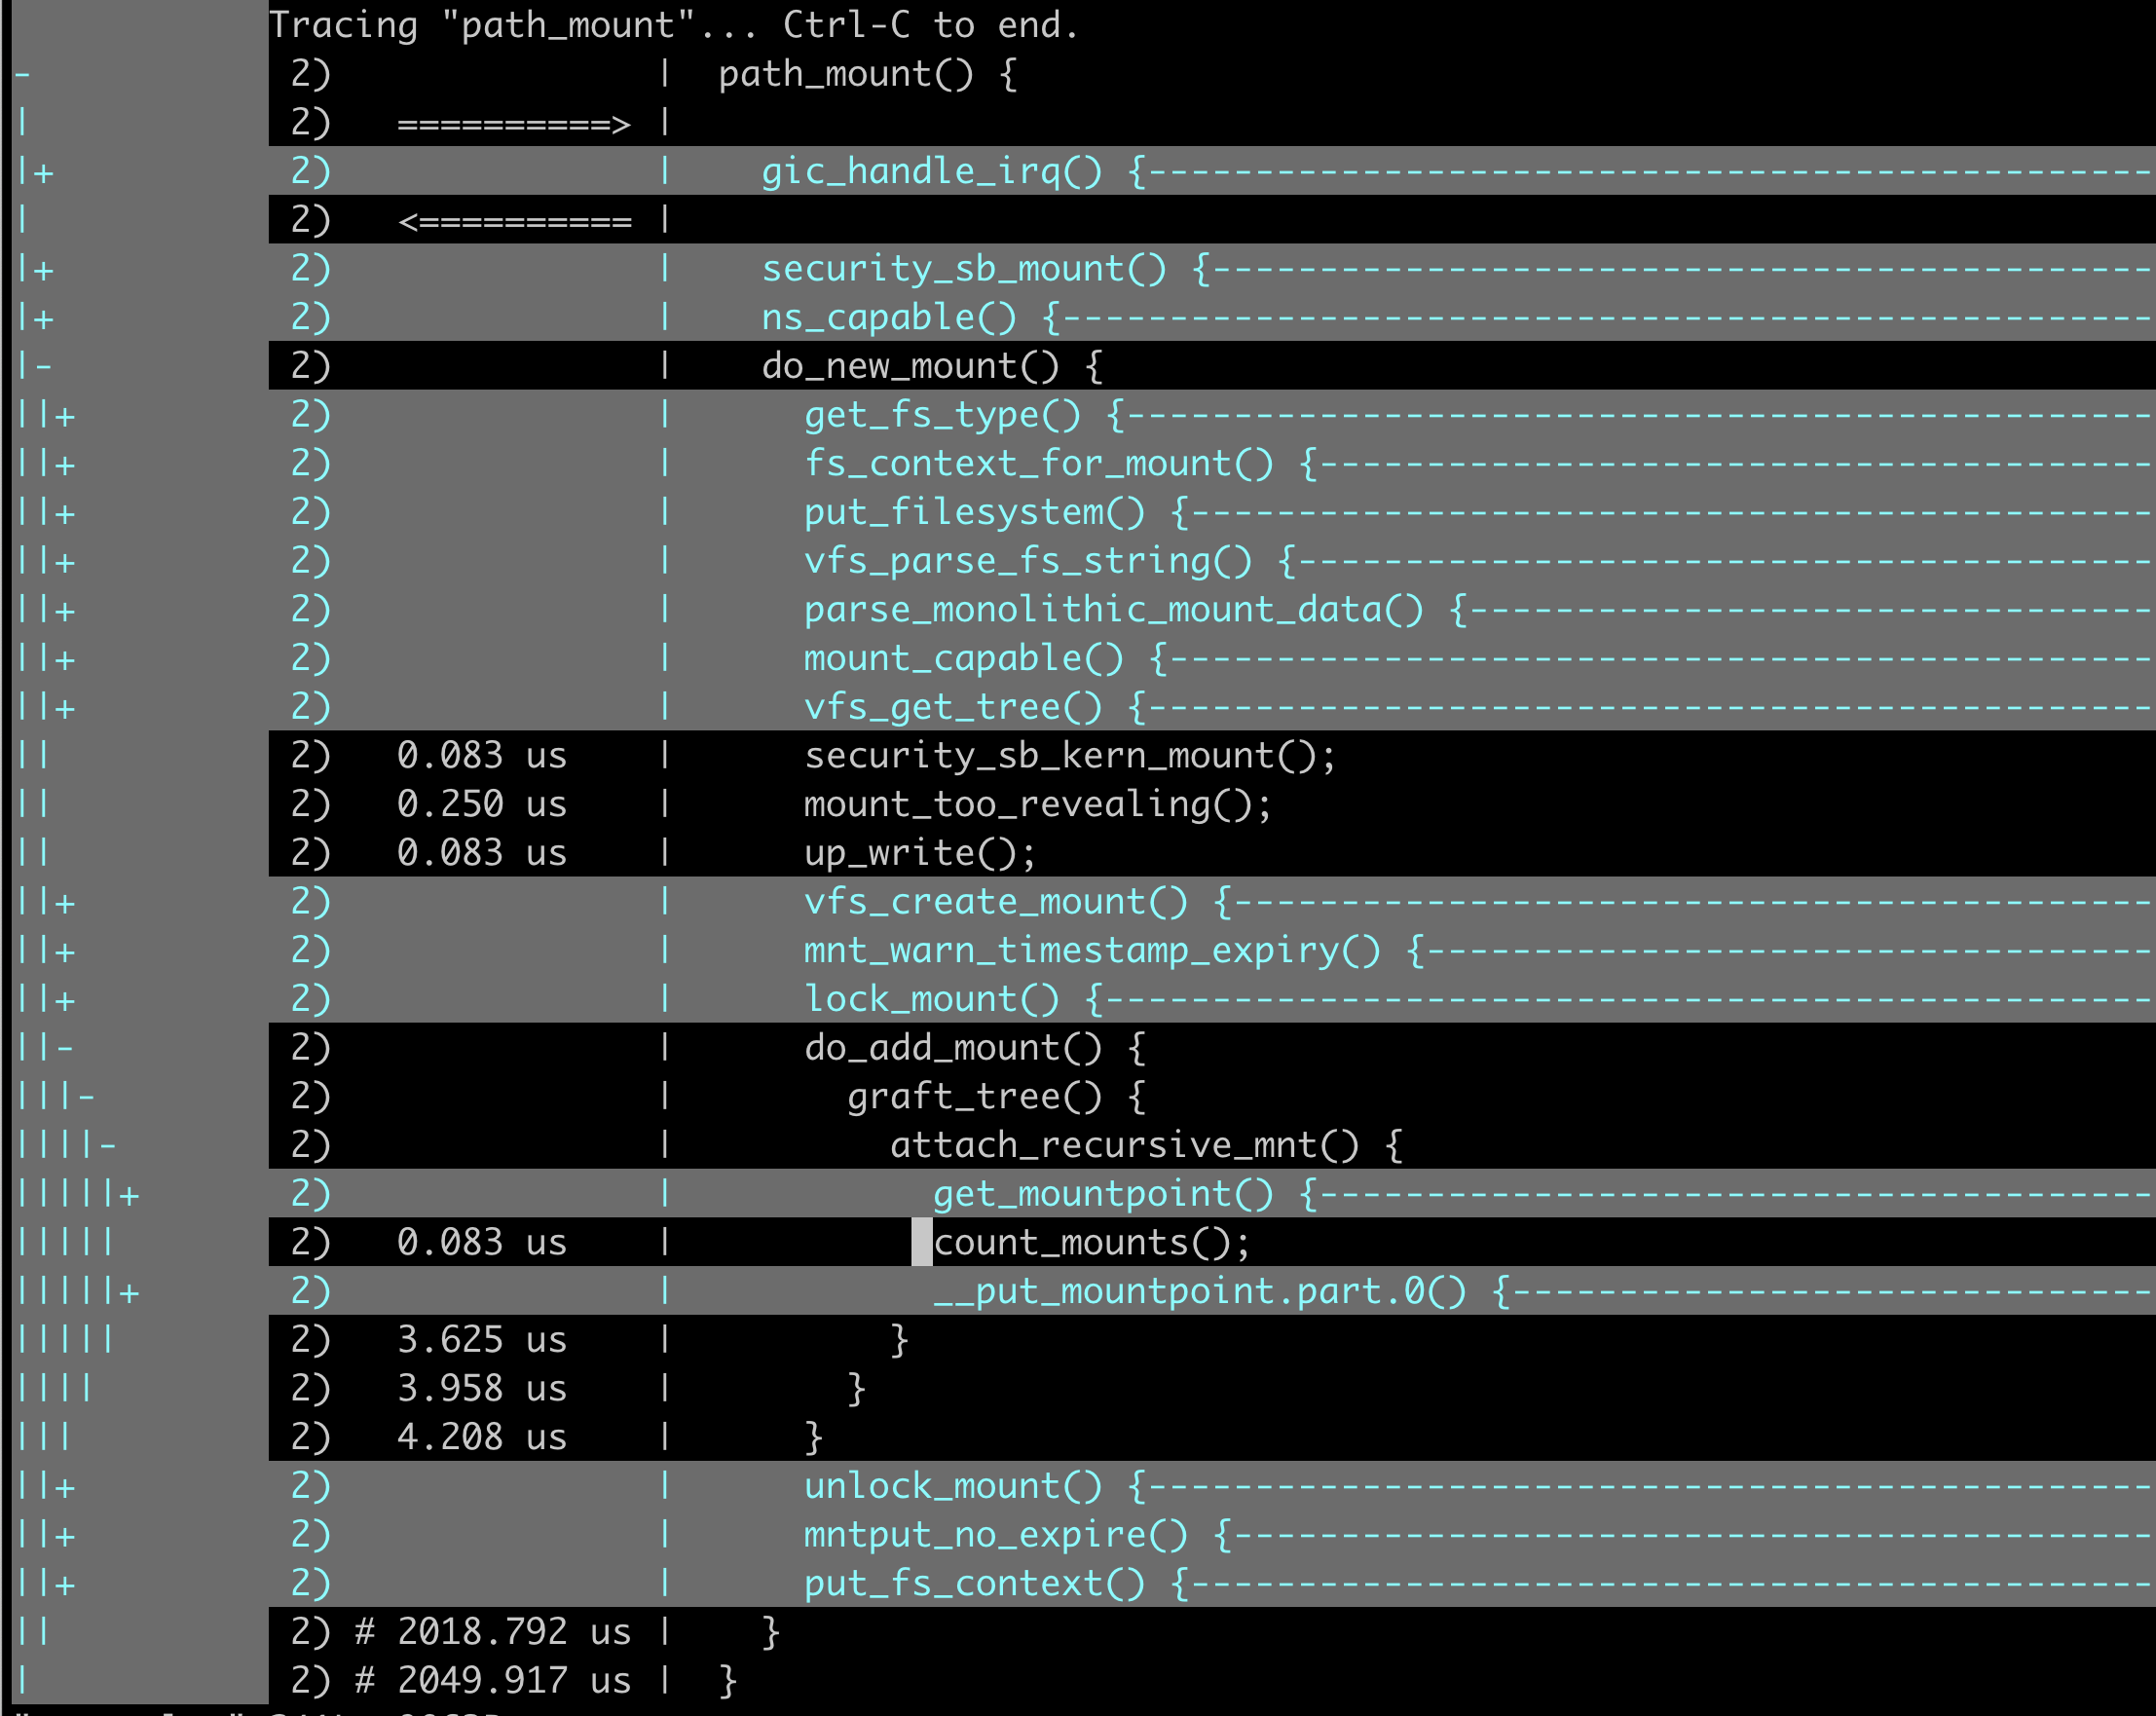
Based on the gradually analyzed last possibly error-prone function calls within the kernel functions, we can deduce the calling logic:
|
|
Based on the aforementioned function call hierarchy, it is natural to speculate that the count_mounts function returned an error, ultimately leading to the return from the __arm64_sys_mount function to the user space.
Since this is a speculation, it requires verification. We need to obtain the return values of the entire function call chain. Use the BCC tool trace-bpfcc to trace related function return values. The help documentation of trace-bpfcc is extensive and can be found in the trace_example.txt file, which is omitted here.
Before using the trace-bpfcc tool for tracing, it is necessary to check the prototype declarations of the relevant functions in the kernel.
To validate the speculation, we need to track the return values of core functions along the entire call chain. The trace-bpfcc tool can simultaneously trace multiple function return values by using ‘xxx’ ‘yyy’ for separation.
|
|
The command r::__arm64_sys_mount() "%llx", retval can be interpreted as follows:
- In
r::__arm64_sys_mount,rindicates tracking the return value of the function; "%llx", retvalwhereretvalis the variable for the return value, and"%llx"is the format for printing the return value;
The traced return value 0xffffffe4 converted to decimal is precisely -28 (0x1B), which equals -ENOSPC (28).
The underlying mechanism of Trace-bpfcc uses the perf_event for event triggering. Due to multicore concurrency, the order cannot be completely guaranteed. In higher kernel versions, switching event triggering to the Ring Buffer mechanism can ensure the order.
2.3 Identifying the Root Cause of the Issue
Through meticulous investigation, we have narrowed down the problem to the count_mounts function. At this point, we need to analyze the main logic flow of the function in the source code. Let’s directly examine the code, fortunately, the function’s code is concise and relatively easy to understand:
|
|
Based on a simple understanding of the code logic, we can infer that the number of files mounted in the current namespace exceeds the maximum value allowed by the system (sysctl_mount_max, which can be set via /proc/sys/fs/mount-max).
To replicate the issue, in the local environment, I have set the value of /proc/sys/fs/mount-max to 10 (default is 100000), resulting in the same error as in the production environment.
|
|
After identifying the root cause, we can adjust this value back to the default of 100000 and rerun the docker run command for successful execution.
In a real production environment, issues may be more complex, such as abnormal mounts or leaks. Nonetheless, the troubleshooting approach can be guided by the insights provided in this article.
With this, we have completed the issue identification stage. However, there are still some doubts from the tracing process that need clarification. These insights gained during the troubleshooting process, including the pitfalls encountered, are crucial knowledge for effectively using tools to diagnose issues.
Given that we have analyzed the source code based on the flow, can we expect a perfect match between what we observe during tracing and the actual code execution? The answer is not necessarily; sys_mount tracing is one such scenario that doesn’t align precisely with the code logic.
So, let’s compare and analyze the code flow of sys_mount with the actual tracing process to uncover the discrepancies.
3. Analysis of Discrepancies Between Code Flow and Tracing Process
The function sys_mount is defined in fs/namespace.c file:
|
|
During handling of the above exception, another exception occurred:
|
|
The system lacks the ausyscall command, for installation methods on different systems, please refer to ausyscall:
|
|
References
- Author: DavidDi
- Link: https://www.ebpf.top/en/post/no_space_left_on_devices/
- License: This work is under a Attribution-NonCommercial-NoDerivs 4.0 International. Kindly fulfill the requirements of the aforementioned License when adapting or creating a derivative of this work.
- Last Modified Time: 2024-02-07 00:32:34.825960615 +0800 CST