What? I/O Wait ≠ I/O Bottleneck?
Read more at: https://www.ebpf.top/post/cpu_io_wait
1. Definition of I/O Wait
I/O Wait is a performance metric for a single CPU, indicating the idle time consumed when threads in the CPU dispatch queue (in the sleep state) are blocked on disk I/O. The CPU’s idle time is divided into truly idle time and time spent blocked on disk I/O. A higher CPU I/O Wait time indicates a possible bottleneck in the disk, causing the CPU to wait idle. If you find this definition a bit confusing, then please continue reading. I believe that after you read the testing and verification process in this article, your understanding of the above definition will be different.
2. Test and Verification
The local test verification environment is: Ubuntu 22.04, CPU 12 cores, Kernel 6.2.0-34-generic
|
|
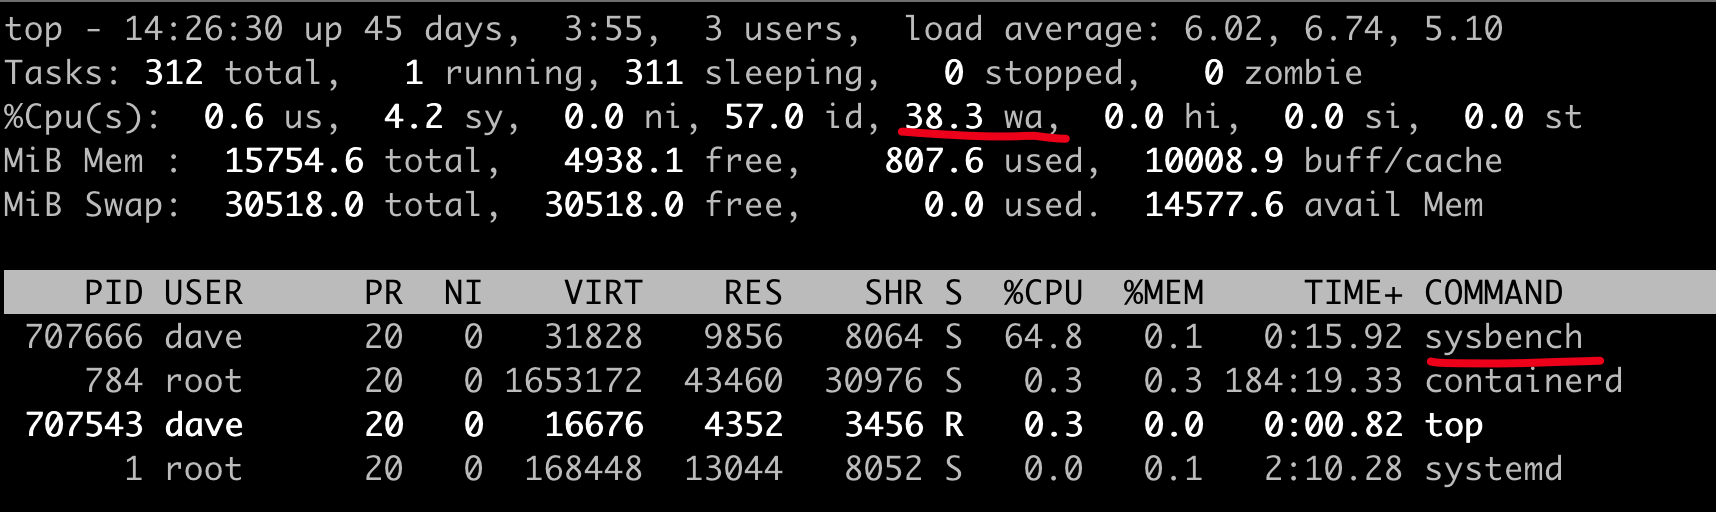
We use the sysbench tool for corresponding stress testing and observe the performance of I/O Wait. To better demonstrate the effect, we set the number of threads to 50% of all CPU cores during the I/O testing process (in this article --threads=6)
|
|
While running the I/O stress test, we use the top command to check the CPU usage, where we can see the wa (I/O wait) value displayed, which is 38.3% in the image below:
By looking at this, one might think that the CPU I/O Wait value is correctly showing the CPU usage related to I/O wait. While we maintain the sysbench I/O test, we simultaneously start a CPU-intensive test, and then we observe the value of wa in top. In this test, we set to use all CPU cores.
|
|
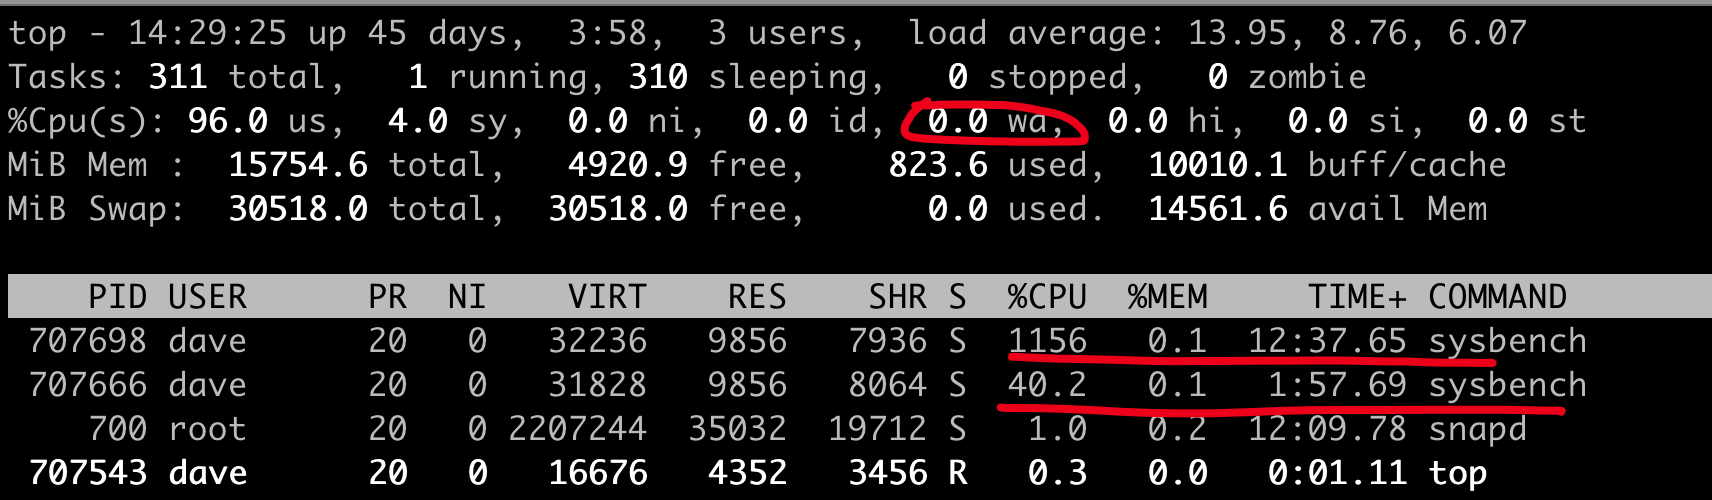
Did something magical happen? Did the wa change to 0.0? Does it feel like the I/O bottleneck completely disappeared when running CPU load? Did the I/O pressure suddenly vanish from the system? We notice that there are two sysbench processes running during the test, corresponding to the I/O and CPU testing processes, so in reality, the I/O bottleneck still exists.
Therefore, although a high I/O Wait can indicate that many processes in the system are waiting for disk I/O, even when the I/O Wait is low or even 0, disk I/O may still become a bottleneck for certain processes on the system.
With the results of our tests in mind, it seems that I/O Wait may not be reliable. So, what should we use to provide better visibility into I/O? We can use the vmstat tool to investigate.
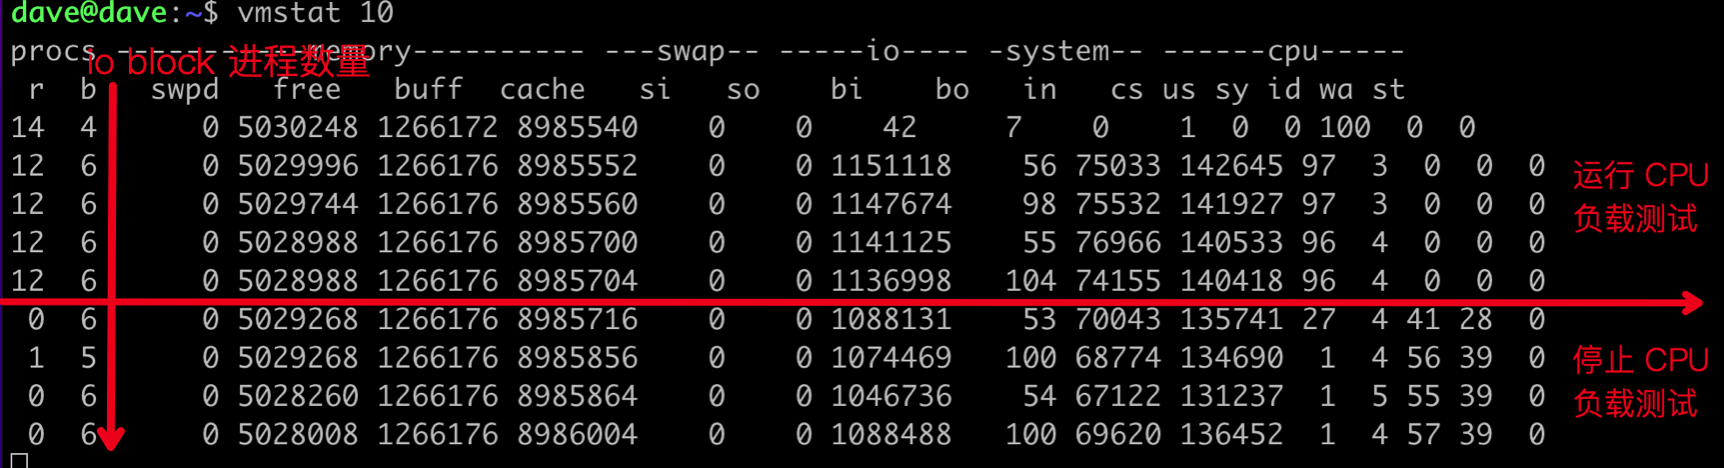
While running I/O and CPU loads simultaneously, we use the vmstat tool to observe them. After a certain time of testing, we stop the CPU load test sysbench process. The image below clearly shows the comparison trend before and after stopping.
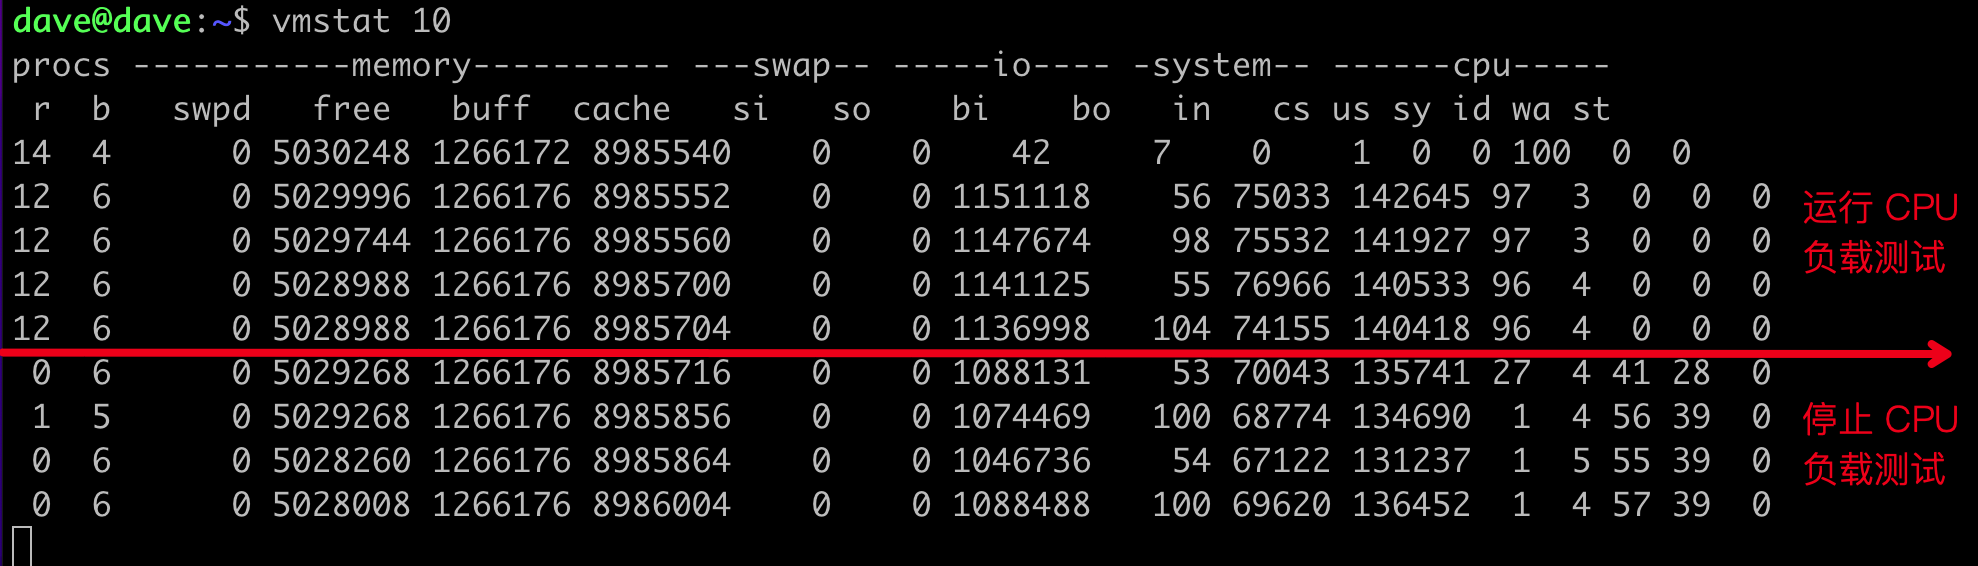
Firstly, we notice a significant change in the wa column before and after running the CPU load test, and the data in the r column is also reflected accordingly (r indicates the number of tasks running, with a value of 12 when running the CPU load test).
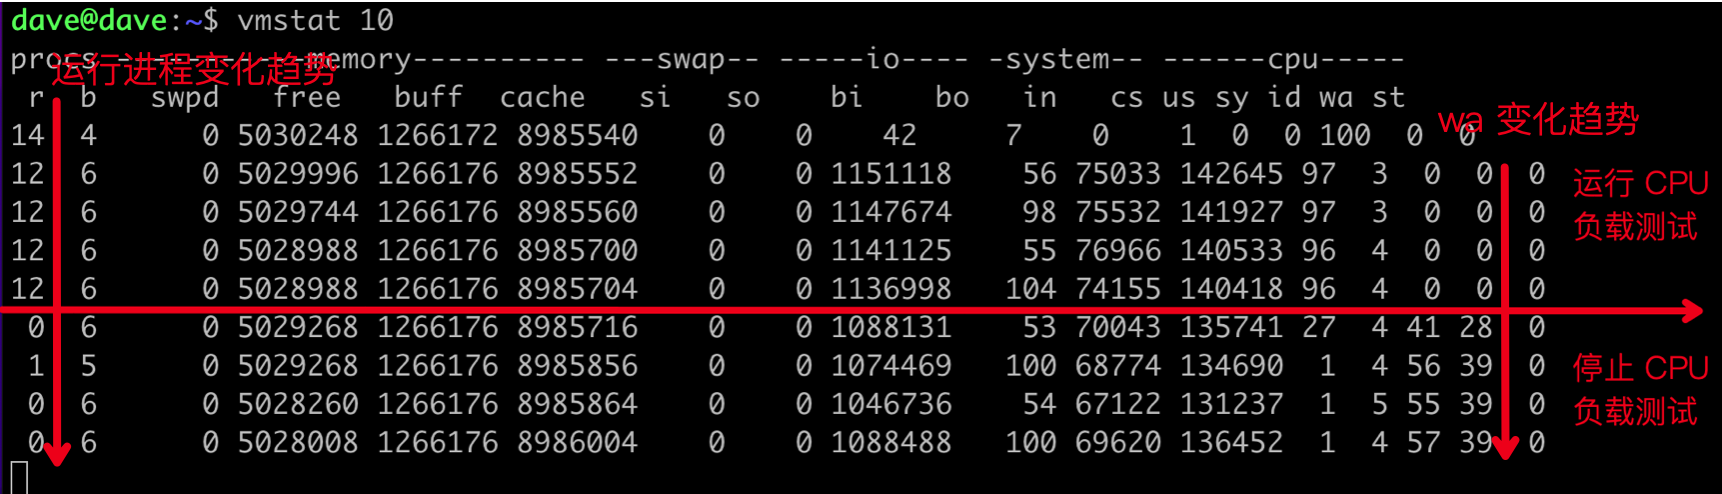
The “b” column in the vmstat display data represents the processes blocked on disk I/O. We observe that this value remains around 6 both before and after running the sysbench CPU load test, which corresponds to the --threads=6 specified in sysbench during I/O testing. This column value indicates that even when wa is 0.0, there are still 6 processes waiting for I/O in the system.
3. Further Clarification on Disk Throughput and Processes with High I/O FrequencyAfter identifying process I/O wait conditions through the vmstat b column, we can further define them using iostat and iotop.
|
|
nvme0n1is a local disk.
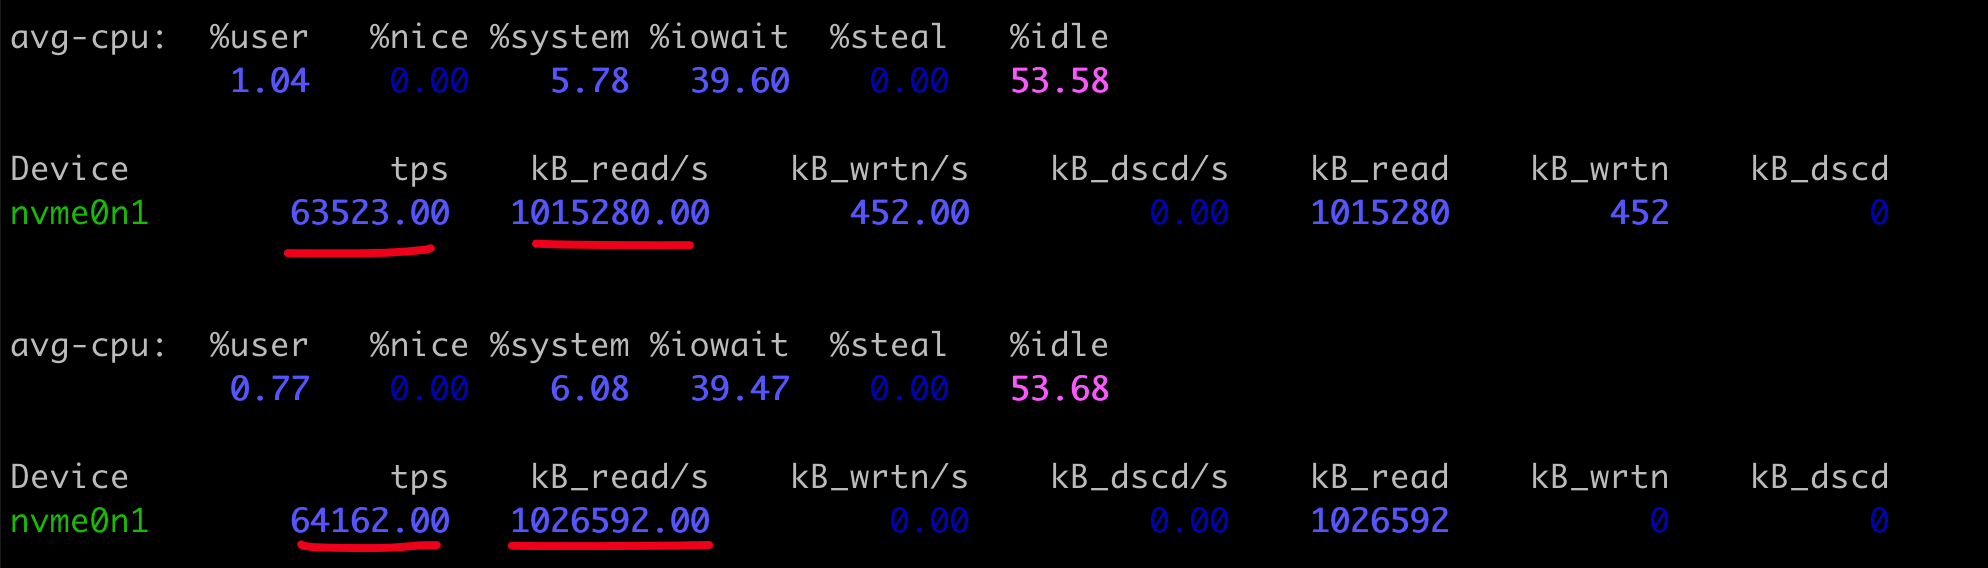
Where:
tps: Transactions per second (IOPS)kB_read/s,kB_wrtn/s: Number of kilobytes read and written per second
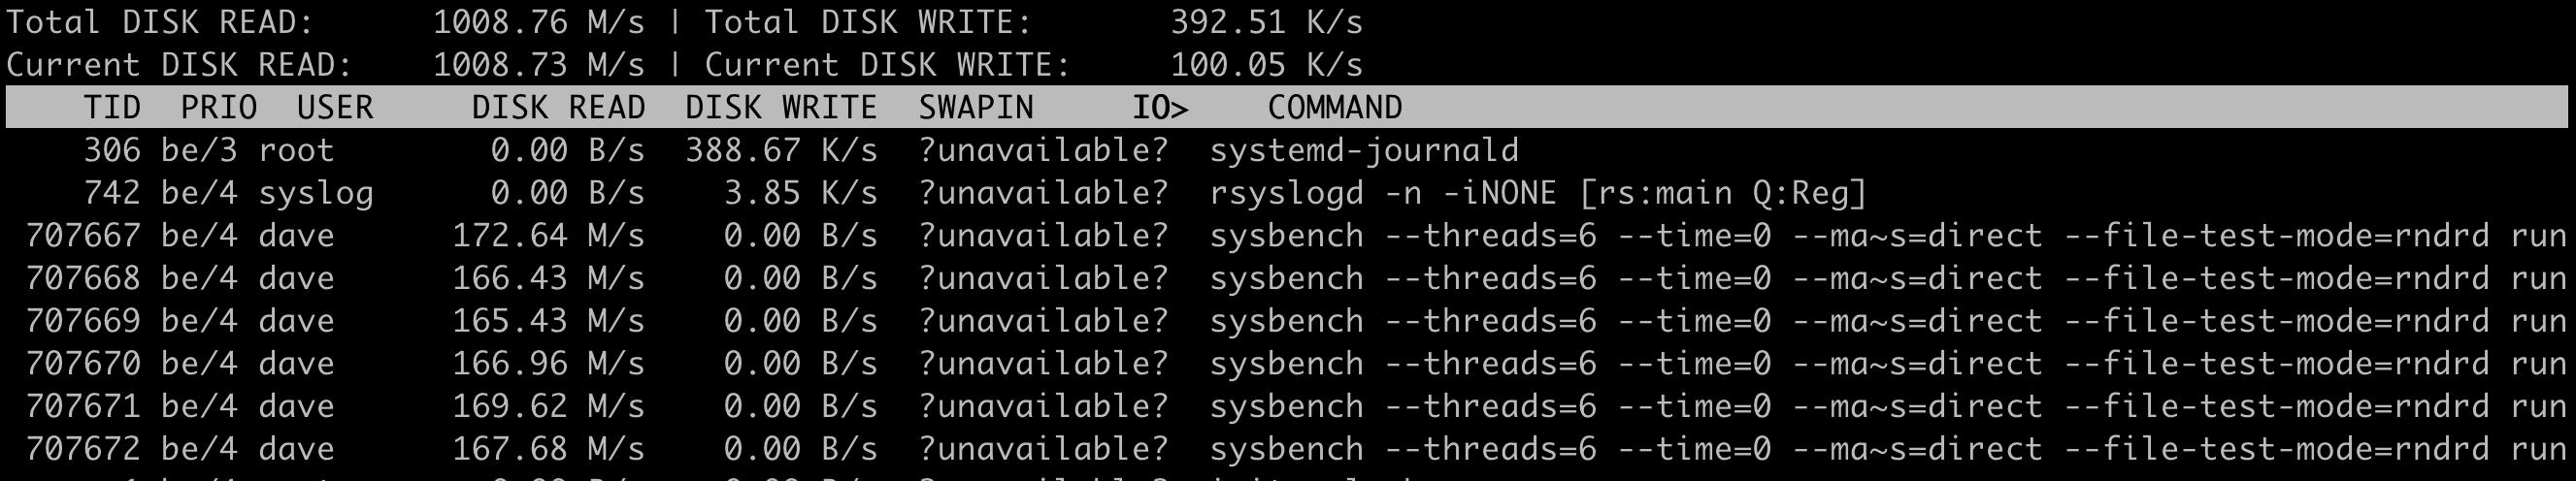
The iotop tool can quickly locate process information with frequent reads and writes in the current system.
4. Analysis of Kernel CPU Statistics Implementation
After the above analysis, we attempt a simple analysis from the perspective of kernel code implementation (kernel code version 6.2.0):
|
|
The account_idle_time function is responsible for implementing the idle time of the current CPU. If the nr_iowait value on the CPU is not 0, the idle time will be counted in iowait; otherwise, it will be counted in idle.
|
|
From the code, we can see that to be in an I/O wait state, two conditions must be met:
- There must be processes waiting for I/O requests to be completed on the current CPU.
- The CPU must be idle, meaning there are no runnable processes.
5. Conclusion
Through the above test, we can see that I/O Wait can be a very confusing metric. If CPU-intensive processes are running, the I/O Wait value may decrease. However, even if the I/O Wait metric decreases, disk I/O still blocks process execution as before. Therefore, when determining whether there is an I/O bottleneck, we cannot simply rely on the high or low value of I/O Wait to conclude if there is an I/O bottleneck in the system.
We believe that after reading this document, you will no longer fall into the trap of the I/O Wait metric, and that is where the value of this article lies.
References
- Understanding Linux IOWait 2023-05-10
- What is iowait and how does it affect Linux performance? 2023-10-2 Hayden James
- Chat about misunderstood iowait 2023-05-18 xiongcc
- Author: DavidDi
- Link: https://www.ebpf.top/en/post/cpu_io_wait/
- License: This work is under a Attribution-NonCommercial-NoDerivs 4.0 International. Kindly fulfill the requirements of the aforementioned License when adapting or creating a derivative of this work.
- Last Modified Time: 2024-02-07 00:10:14.066154901 +0800 CST