Introduction, Usage, and Examples of BPF Trace Mechanism Rawtracepoint
Read the article at: https://www.ebpf.top/post/en/bpf_rawtracepoint
1. Common Hook Types in eBPF Trace
eBPF allows tracing events in various categories within the trace domain as follows:
- Kernel static trace points
tracepoint/rawtracepoint/btf-tracepoint- Refer to
/sys/kernel/tracing/available_events
- Refer to
- Kernel dynamic trace points
k[ret]probe,fentry/fexit(based on BTF)- Kprobe
/sys/kernel/tracing/available_filter_functions
- Kprobe
- User-space static trace points USDT
- Viewing method:
readelf -nor bpftrace toolbpftrace -l 'usdt:/home/dave/ebpf/linux-tracing/usdt/main:*'
- Viewing method:
- User-space dynamic trace:
u[ret]probe, obtainable vianm hello | grep main - Performance monitoring counters PMC
perf_event
This article will focus on rawtracepoint within kernel static tracing, concluding with practical code examples using the libbpf development library and bpftrace.
2. BPF Rawtracepoint
In Linux kernel version 4.17, eBPF author Alexei Starovoitov introduced a raw tracepoint. In contrast to tracepoint, rawtracepoint directly exposes original parameters, somewhat avoiding the performance overhead of creating stable tracepoint parameters. However, as it directly exposes original parameters to users, this falls into the category of dynamic tracing and is considered an unstable tracing mode. Comparatively, rawtracepoint is more stable than kprobe since both the name and parameter changes of tracepoints are relatively infrequent. It can offer better performance than tracepoint. The implementation of rawtracepoint can be found at bpf: introduce BPF_RAW_TRACEPOINT. Performance benchmarks submitted by the author indicate improvements in both kprobe and tracepoint tracking, making it suitable for long-term monitoring of frequently called functions, such as system calls. The Tracee security product monitoring system calls is implemented using the rawtracepoint approach.
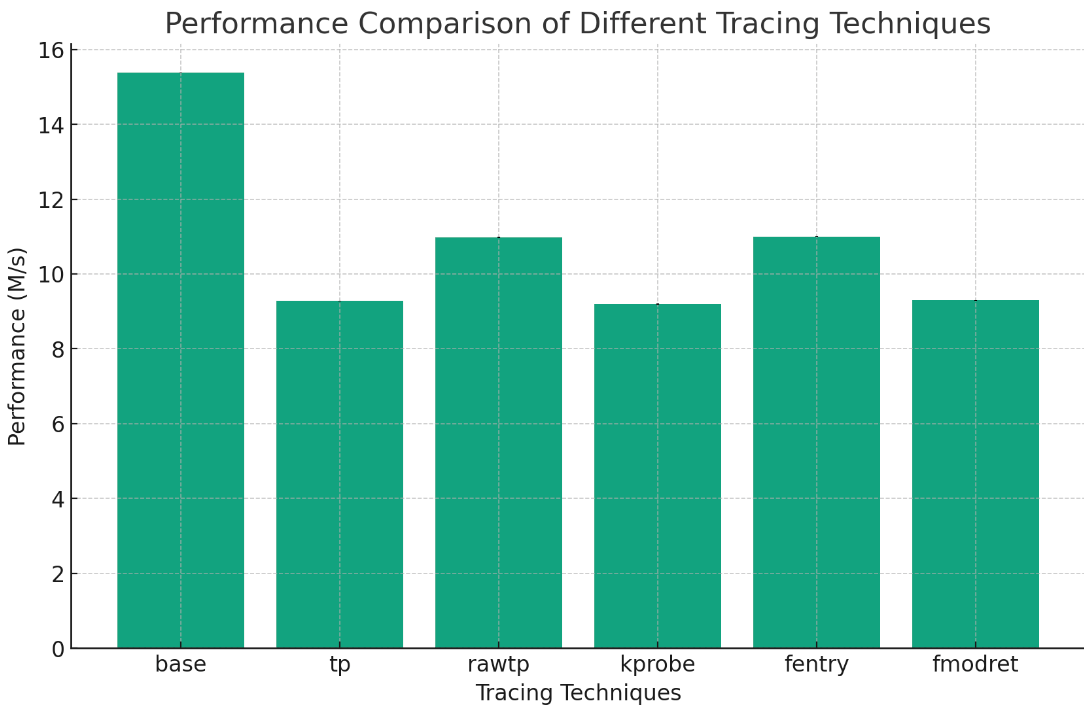
2.1 Trace Performance Enhanced by 20%
The table below shows original performance data at the time of the author’s submission:
|
|
The following data is based on running the official bench tool from the kernel code and plotting the results (requires kernel code compilation beforehand), with the y-axis representing instructions per second:
To run the performance benchmark:
|
|
2.2 Rawtracepoint Tracking Event Inspection and Quantity Statistics
bpftrace version 0.19 supports rawtracepoint. You can use bpftrace -l to view, where the program type abbreviation is rt, and parameter types are arg0, arg1, and so on. You can view the complete list using:
|
|
On an Ubuntu 22.04 system (kernel version 6.2), there are approximately over 1480 rawtracepoints:
|
|
Keen observers may notice that there are 2124 tracepoint events in the system. What causes this discrepancy?
How does bpftrace obtain rawtracepoint? By analyzing the source code, we find that bpftrace reads all tracepoints from the /sys/kernel/debug/tracing/available_events file while filtering out those starting with syscalls:sys_enter_ or syscalls:sys_exit_. Filtering is necessary due to two special cases:- Use sys_enter to represent the sys_enter_xxx event under the syscalls category: SEC("raw_tracepoint/sys_enter")
- Use
sys_exitto represent thesys_exit_xxxevent under thesyscallscategory:SEC("raw_tracepoint/sys_exit")
In this way, you can monitor all system call events using sys_enter and sys_exit events.
You can find the events that rawtracepoint can monitor by examining the contents of the /sys/kernel/debug/tracing/available_events file. The format of each line in the file is:
|
|
However, in rawtracepoint, only the value of <name> is used, not the entire <category>:<name>. For example:
|
|
2.3 Passing Parameter Changes
From the perspective of a BPF program, the parameter definition and access for the rawtracepoint method are as follows. We will provide a complete sample program later.
|
|
All parameters are passed in through an array pointer. Here, based on the task_rename tracepoint defined in the __set_task_comm function, we will compare the tracking parameters for tracepoint and rawtracepoint. The task_rename tracepoint function declaration in the kernel is as follows:
|
|
If the system does not have the task_rename event, we can compile the following program to manually trigger and verify the test:
|
|
3. Example of Using rawtracepoint in BPF Programs
3.1 libbpf Library (Based on CO-RE)
The corresponding tracepoint for task_rename in the system is tracepoint:task:task_rename, and the format definition for the tracepoint is as follows:
|
|
You can use structures in the libbpf library to write code in your program, as shown below:
|
|
If you use the rawtracepoint method, the parameters of __set_task_comm(struct task_struct *tsk, const char *buf, bool exec) are pushed into the bpf_raw_tracepoint_args structure in sequence, and args[0] is the parameter struct task_struct *tsk , args[1] is const char *buf, which represents the renamed comm_name, and so on for other parameters.
The parameter structure of bpf_raw_tracepoint_args is as follows:
|
|
The codes of raw_tracepoint as blow show:
|
|
3.2 Bpftrace Sample Code
Starting from version 0.19, bpftrace supports rawtracepoints. The program type abbreviation is rt, and the argument type is arg0, arg1, etc.
You can use bpftrace -l to check the list of available tracepoints, where the program type is represented by rt and the argument types are like arg0, arg1.
For bpftrace to trace using tracepoint:task:task_rename:
|
|
For bpftrace to trace using rawtracepoint:task_rename:
|
|
See Also
- The art of writing eBPF programs: a primer
- https://docs.kernel.org/bpf/libbpf/program_types.html https://libbpf.readthedocs.io/en/latest/program_types.html
- Introduction to the rawtracepoint mechanism
- Common issues in using raw tracepoints in ebpf/libbpf programs
- Parameter passing for BPF program tracepoint and raw_tracepoint
- Author: DavidDi
- Link: https://www.ebpf.top/en/post/bpf_rawtracepoint/
- License: This work is under a Attribution-NonCommercial-NoDerivs 4.0 International. Kindly fulfill the requirements of the aforementioned License when adapting or creating a derivative of this work.
- Last Modified Time: 2024-03-10 21:59:27.587750011 +0800 CST