Dynamic Tracking Triggered by a Pondering Question: A 'Case Study'
This article can be found at: https://www.ebpf.top/post/ftrace_kernel_dynamic
In the Geek Time’s “Mastering Container Battles” by Teacher Li Chengyuan, a pondering question was left in the extra session 04 | Understanding ftrace(2): How to Understand the Technology Behind ftrace Tracepoint and kprobe?:
Consider this, how can we observe that the first instruction of the corresponding kernel function has been replaced after we register a probe with kprobe for it?
Kprobe is a mechanism for dynamic tracking of kernel functions. By using this mechanism, almost all kernel functions can be tracked (excluding those annotated with __kprobes/nokprobe_inline and those marked with NOKPROBE_SYMBOL). There are currently two main mechanisms for implementing the kprobe tracking mechanism:
-
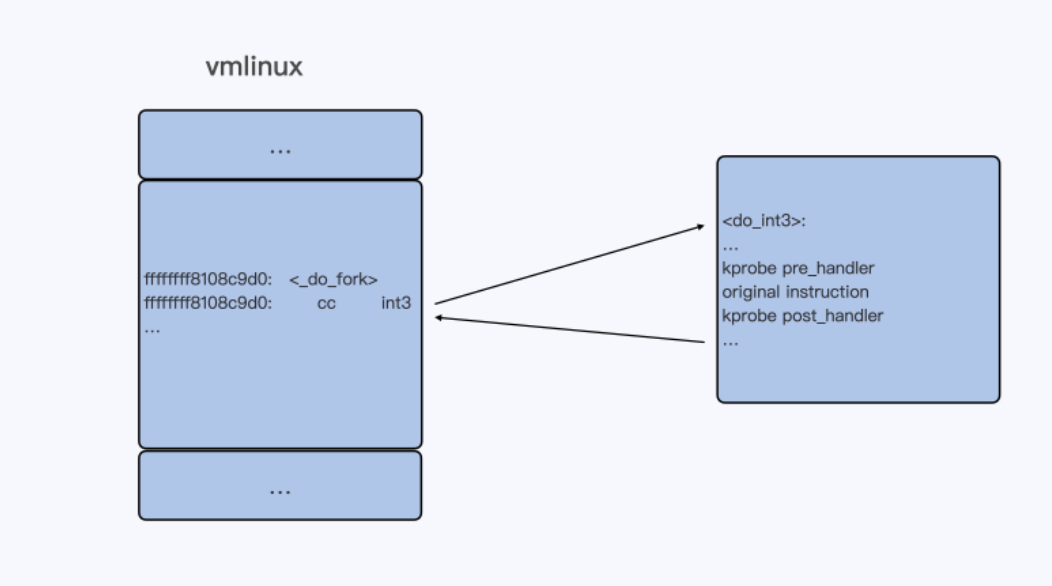
In general, when a kprobe function is registered, the instruction code of the target address in kernel code is replaced with “cc,” which translates to the int3 instruction. Consequently, when the kernel code reaches this instruction, an exception is triggered, leading it to enter the Linux int3 exception handler, do_int3(). In this function, a check is performed to see if a corresponding kprobe has been registered, and if so, the pre_handler(), the instruction before replacement, and post_handler() are executed in sequence.
-
When the kernel traces functions based on ftrace, 5 bytes at the beginning of the function are reserved with
callq <__fentry__>(which are replaced with nop during startup). The kprobe tracking mechanism uses the 5 bytes reserved by ftrace for tracing and replaces them withftrace_caller, bypassing the use of the int3 software interrupt instruction replacement.
Regardless of the method used above, the basic principle of kprobe implementation is the same: replace the target instruction with another one that makes the program jump to a specific handler and then execute the registered probe functions.
In this article, I will verify the entire dynamic replacement mechanism based on the ftrace mechanism. If you are unfamiliar with ftrace, I recommend reading Essential Knowledge of Linux Native Tracing Tool Ftrace in advance.
1. Basic Knowledge
1.1 Default Compilation
Let’s implement a very simple program in C for a basic verification:
|
|
After compiling with default parameters, the code looks like the following, showing no special definitions at the function header.
|
|
1.2 Using the -pg Option
When compiled with the -pg parameter, we can see a call to the mcount function added at the function header, a mechanism commonly employed for running program performance analysis:
|
|
When the
-pgoption is added with gcc, the compiler will add a call to the mcount/fentry function at the function header (excluding functions with the notrace attribute);#define notrace __attribute__((no_instrument_function))
1.3 Using the -pg and -mfentry Options
After version 4.6, gcc introduced the -mfentry compilation option to replace mcount with a more concise and efficient __fentry__ function call, which is now the default approach for x86 architecture in Linux Kernel 4.19.
|
|
Here we take fentry as an example, the function call will occupy 5 bytes. In the Linux kernel, the fentry function is identified as retq for direct return.
|
|
Even though it directly returns through retq, calling each function still incurs approximately 13% performance overhead. During actual operation, the ftrace mechanism will directly replace the 5 bytes (ff 15 05 2e 00 00 call __fentry__) with nop instructions when the kernel starts. In the x86_64 architecture, nop instruction is 0F 1F 44 00 00H.
When enabling the ftrace dynamic tracing mechanism (CONFIG_DYNAMIC_FTRACE), after setting the tracing function, the kernel will dynamically replace the current nop instruction with a jump to the ftrace_caller function, thus achieving dynamic tracing. To avoid triggering multi-core exceptions during the replacement process, the first instruction is first replaced with the 0xcc interrupt instruction, and then the subsequent instructions are replaced. For specific implementation, refer to
void ftrace_replace_code(int enable).
1.4 Kernel Verification
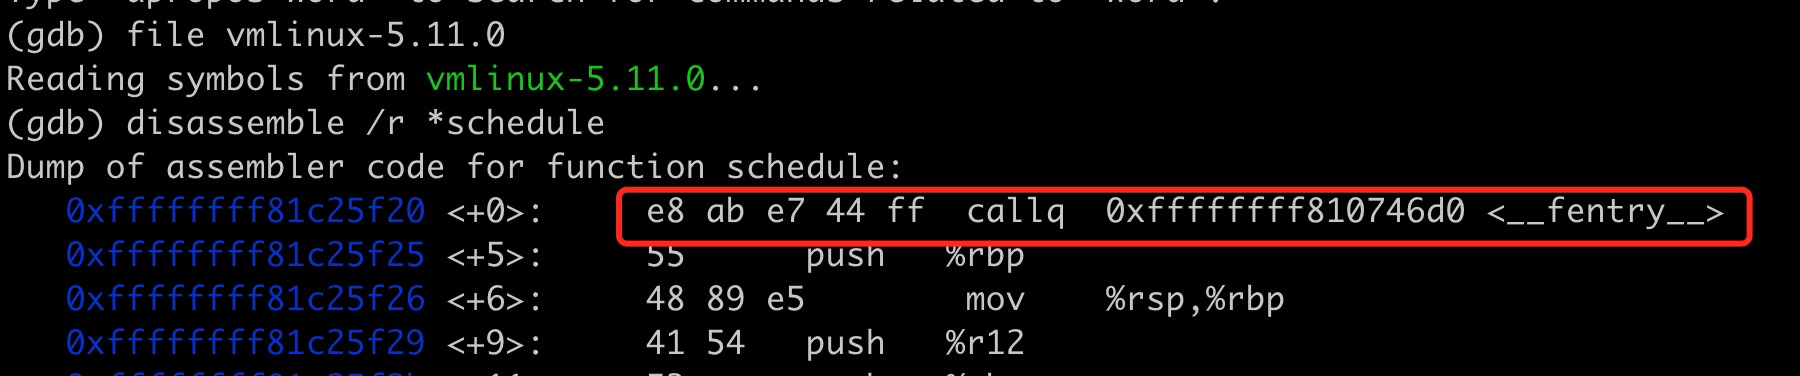
Taking the kernel function schedule as an example, when debugging vmlinux files with symbol information using gdb, we can directly view the compiled assembly code of the function:
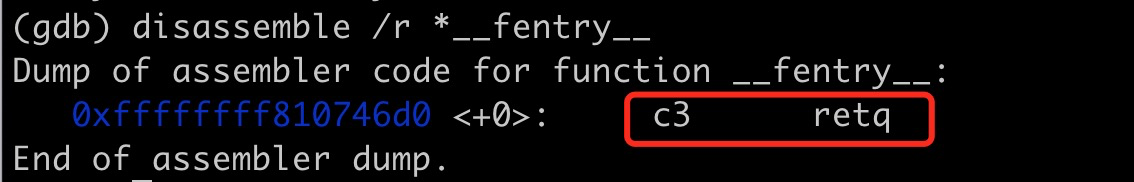
The __fentry__ function is defined as the retq instruction:
Explanation of the call assembly instruction:
0xffffffff81c33580 <+0>: e8 1b 41 44 ff call 0xffffffff810776a0 <__fentry__>e8 represents call, 1b 41 44 ff is the offset relative to the next instruction (0xffffffff81c33580 + 5), FF 44 41 1B is a negative number, its 2’s complement is BB BE E5, and 0xffffffff810776a0 - 0xffffffff81c33585 = -bbbee5
2. Validation of kprobe tracing mechanism in ftrace
Here, we plan to verify 3 things:
- After the kernel starts, the call instruction at the beginning of a function will be replaced with a nop instruction.
- When setting up kprobe function tracing under ftrace, the nop instruction will be replaced with the corresponding call.
- After kprobe tracing stops, the first 5 bytes of the function header will be replaced with nop instructions. (After verifying 1 and 2, it is easy to validate this)
To verify the dynamic replacement process of kernel functions, I first consider printing the first 5 bytes of the function address in a kernel module.
3. Validation using a Kernel Module
3.1 Using kallsyms_lookup_name
The most common or popular approach is to use the kernel function kallsyms_lookup_name() in a kernel module to obtain the address of the traced function and then print it.
Initially, I also wanted to try this approach. Other methods to obtain kernel symbol addresses can be found in Obtaining Kernel Symbol Addresses. The sample code for the kernel module can be found in hello_kernel_module, and the code is very simple:
|
|
However, I encountered an error during the compilation phase (local environment running 5.11.22-generic):
|
|
For security reasons, in the latest kernels (>= 5.7), the kallsyms_lookup_name function is no longer exported and cannot be used directly in kernel modules. For more information, refer to the article Unexporting kallsyms_lookup_name and the related patch. Some alternative methods are discussed here. For a simplified approach, I used the kprobe registration mechanism (supported only in Linux 5.11), and the complete code is as follows:
|
|
For the complete code, please check get_inst.c. After compiling and installing, you can check the output by using the dmesg command:
|
|
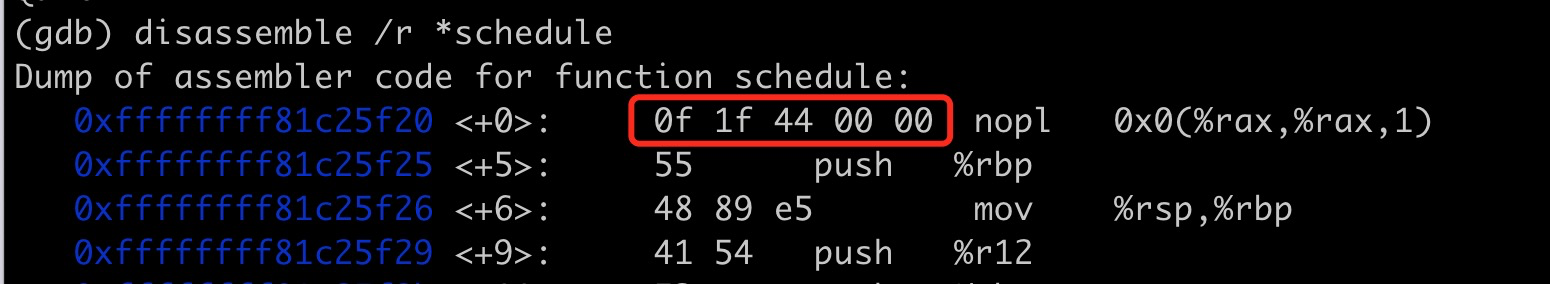
Here we can see that the first 5 bytes of the function have been replaced with NOP instructions (0f 1f 44 00 00), which is processed during kernel startup by the ftrace_init() function. Similarly, the function header of any newly installed kernel module will also be automatically replaced with NOP instructions.
Corresponding to the example of the schedule function in the ftrace pdf is as follows:
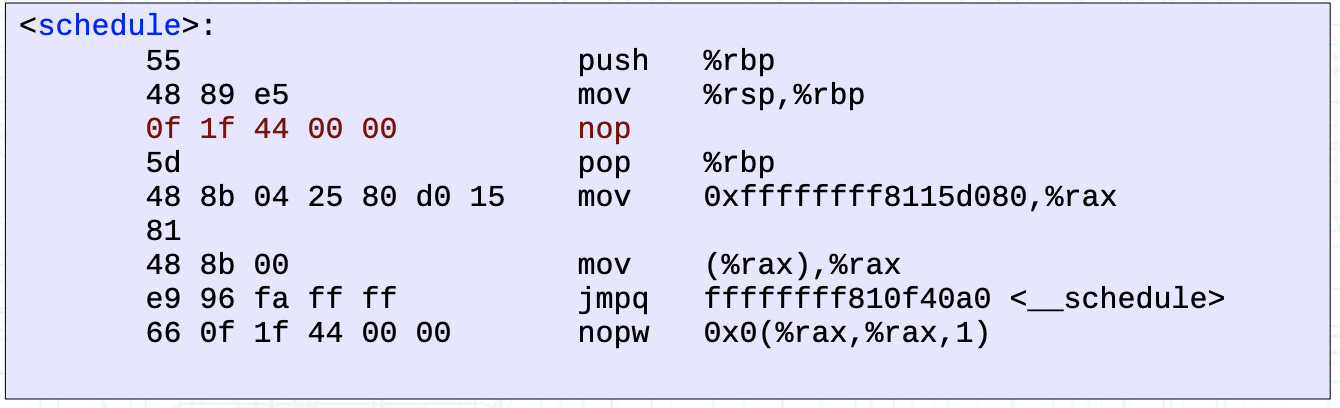
Figure: Before enabling kprobe tracking, the first 5 bytes of the function are NOP instructions. <Image from ftrace pdf P36>
Next, by enabling tracing of the kernel function schedule and performing verification:
|
|
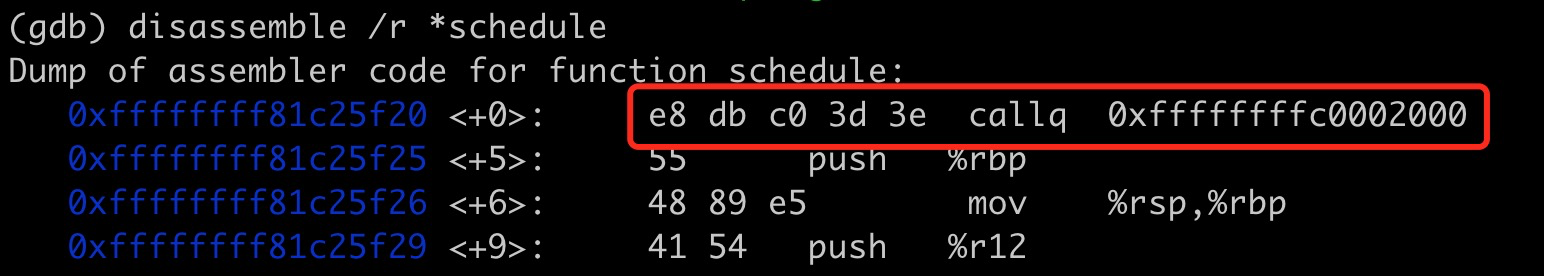
After enabling tracing for the kernel function schedule, we can see that the first 5 bytes (NOP instructions) have been replaced with other function calls. The overall effect is as shown below:
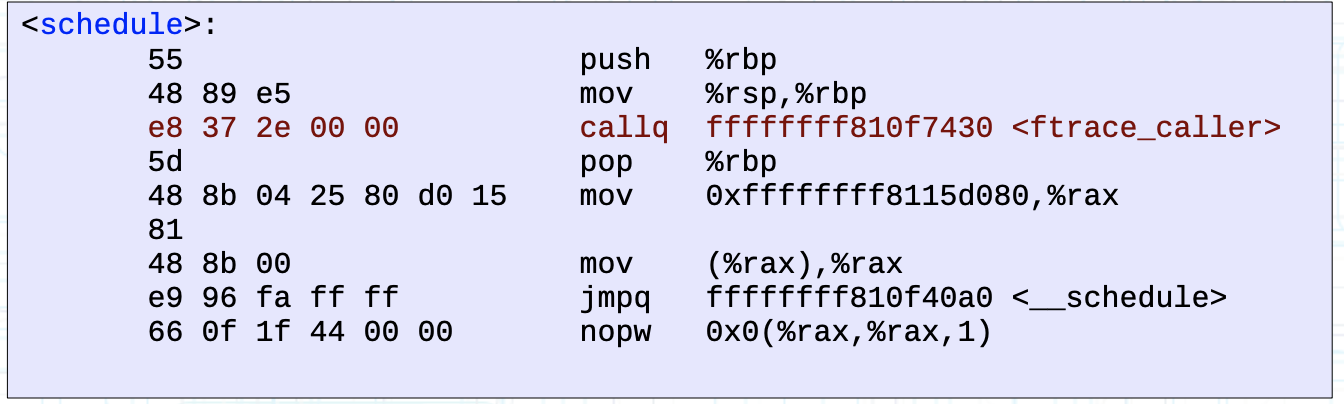 Figure: Replacement effect of NOP instructions after registering kprobe function <Image from ftrace pdf P37>
3.2 Using Kernel Function Addresses Directly (Pitfalls, Optional)
Is it possible to use the addresses directly from /boot/System.map without going through the kallsyms_lookup_name function? The answer is yes, but caution is needed due to Kernel Address Space Layout Randomization (KASLR) mechanism.
KASLR may randomize the addresses of kernel code and data each time the system boots to protect the kernel space from attacks. As a result, the static addresses listed in /boot/System.map will be adjusted to random values. If the symbol address in /proc/kallsyms differs from the address in /boot/System.map, it indicates that KASLR is enabled in the running kernel. To check, root user privileges are required.
|
|
If KASLR is enabled, it is essential to pay attention to the address in /proc/kallsyms each time the machine restarts (the address changes on each reboot). To use the address from /boot/System.map, ensure that KASLR is disabled. To disable KASLR, the nokaslr option can be added to the boot command line, and a reboot is required for this change to take effect.
|
|
We can add a sym variable in the kernel module to obtain the address of the incoming function. The sample code is as follows:
|
|
After ensuring that KASLR is disabled, by compiling the above module and running it, we can obtain results consistent with the above method:
|
|
If KASLR is not disabled and a fixed address is used for compilation, loading the driver would result in an error:
|
|
4. Verification using gdb + qemu
I have compiled a kernel with DEBUG options and related files saved on Baidu Pan, extraction code av28. For detailed instructions on kernel compilation and debugging, refer to Debugging Linux Kernel using GDB + Qemu.
Here’s how to use qemu software for kernel debugging on a Mac environment:
|
|
Download the files from the online link to a local directory before running qemu for testing:
|
|
Note the addition of -machine type=q35,accel=hvf flag for using hvf acceleration in a mac environment. If acceleration is not enabled, it defaults to using the xen virtualization instruction set.
If hvf acceleration is not enabled in the
qemu-system-x86_64command line, the first 5 bytes before the function will differ slightly, defaulting to66 66 66 66 90 data16 data16 data16 xchg %ax,%ax, due to differences in nop instructions across architectures.
|
|
Further tracking can be done on the functions passed in as headers:
|
|
In subsequent page flips, you can observe the invocation of the kprobe_ftrace_handler registration function.
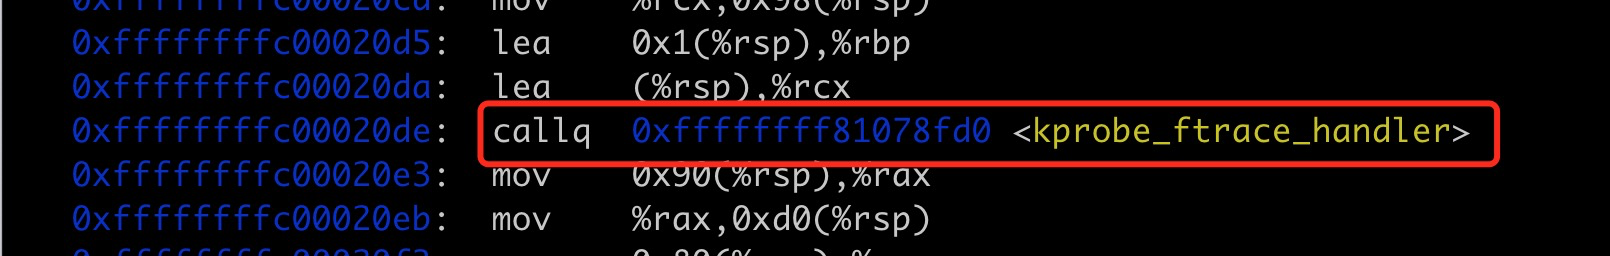
It’s essential to note that the function at address
0xffffffffc0002000is not eitherftraceregistration functionftrace_callerorftrace_regs_caller, but a trampoline dynamically constructed in memory based on these two functions, copying the modified registration function fromftrace_callerorftrace_regs_callerinto this trampoline (for this debug session,ftracefunction isftrace_regs_callerand the event registration function iskprobe_ftrace_handler).
Reference
- PDF by the author of ftrace: Ftrace Kernel Hooks: More than just tracing
- Unveiling ftrace
- Kernel Documentation Function Tracer Design
- Twenty-minute Linux ftrace principle introduction - Cache One
- KASLR
- When ftrace is used in user space
- Setting up a visual kernel debugging environment for Linux kernel debug on macOS
- Author: DavidDi
- Link: https://www.ebpf.top/en/post/ftrace_kernel_dynamic/
- License: This work is under a Attribution-NonCommercial-NoDerivs 4.0 International. Kindly fulfill the requirements of the aforementioned License when adapting or creating a derivative of this work.
- Last Modified Time: 2024-02-07 00:30:51.579668635 +0800 CST