1. k8s master 的流量整体架构
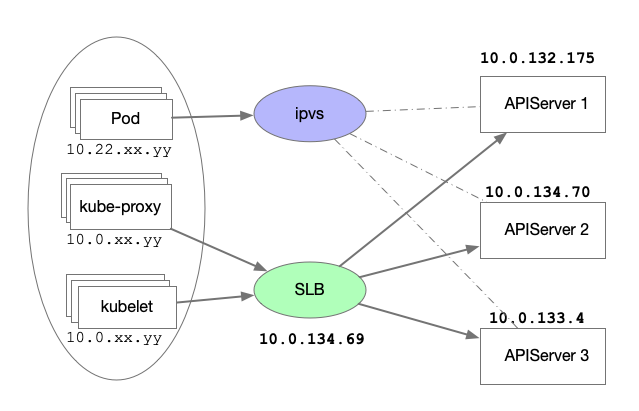
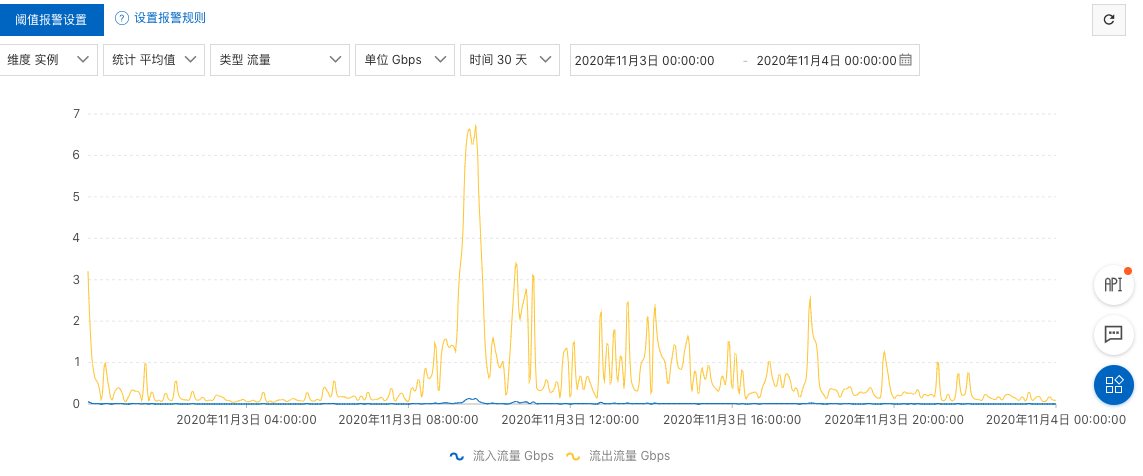
最近 k8s 集群新增不少服务,使得集群的 Pod 数量激增,某天接受到线上 3 台 Master 前置 SLB 流量丢失的告警(SLB 为阿里 ACK Master 默认的 SLB,默认 4 层 SLB,监听端口 6443),通过 SLB 控制台查看,在 8:00 - 9:00 的时刻,整个集群的出口流量带宽已经超过 5G,而阿里的 SLB 流量带宽最大为 5Gbps,而且带宽峰值仅是参考值,而不是业务承诺峰值;同时 SLB 是集群模式,总带宽/4 就是每台承受的最大带宽,单条流打到同一台上较高就会触发秒级分布式限速。通过与相关同事咨询,4 层 SLB 没有办法通过升级规格来抗住跟高的流量,而且在集群中 Pod 2万多个情况下,也不应该出现如此大的流量,因此首先一个问题就是需要快速定位在 SLB 丢包的时候,出口的数据流量到底是流向何处,流量是否符合预期。
排查的障碍点有两个:
- 四层 SLB 没有流量分析,阿里的 SLB 走的 Full-Nat 方式,可以在上面进行短时间抓包,但是我们的高峰点不确定,抓包分析和沟通成本都比较高,而且四层 SLB 直接将连接透传到了 RS(RealServer)上,所有的状态还得在后面的 API-Server 上进行定位;
- API-Server 是 TLS/SSL 加密,没有打开全部访问审计日志,线上流量高峰时候还是偏大,抓包分析也无法看到流量内容;
首先第一步我们需要确定丢包时刻出口流量的出去,这时候想到的第一个工具是 iftop,更多的网络流量监控工具参见这里:Linux 网络监控工具总结。 如果你想直接看到问题排查和结论,可以直接跳转到 3-slb-异常流量分析
2. iftop 工具
iftop 是类似于 top 的实时流量监控工具,底层基于 libpcap 的机制实现,可以用来监控网卡的实时流量,并且可通过指定 tcpdmp 过滤条件快速过滤想要的流量展示。代码仓库地址见这里。
2.1 安装
在 CentOS 系列系统中可以通过 Yum 快速安装。
1
2
3
4
5
6
7
8
9
|
$ sudo yum install iftop -y
Running transaction
  Installing : iftop-1.0-0.21.pre4.el7.x86_64                                                         1/1
  Verifying  : iftop-1.0-0.21.pre4.el7.x86_64                                                         1/1

Installed:
  iftop.x86_64 0:1.0-0.21.pre4.el7

Complete!
|
2.2 界面总览
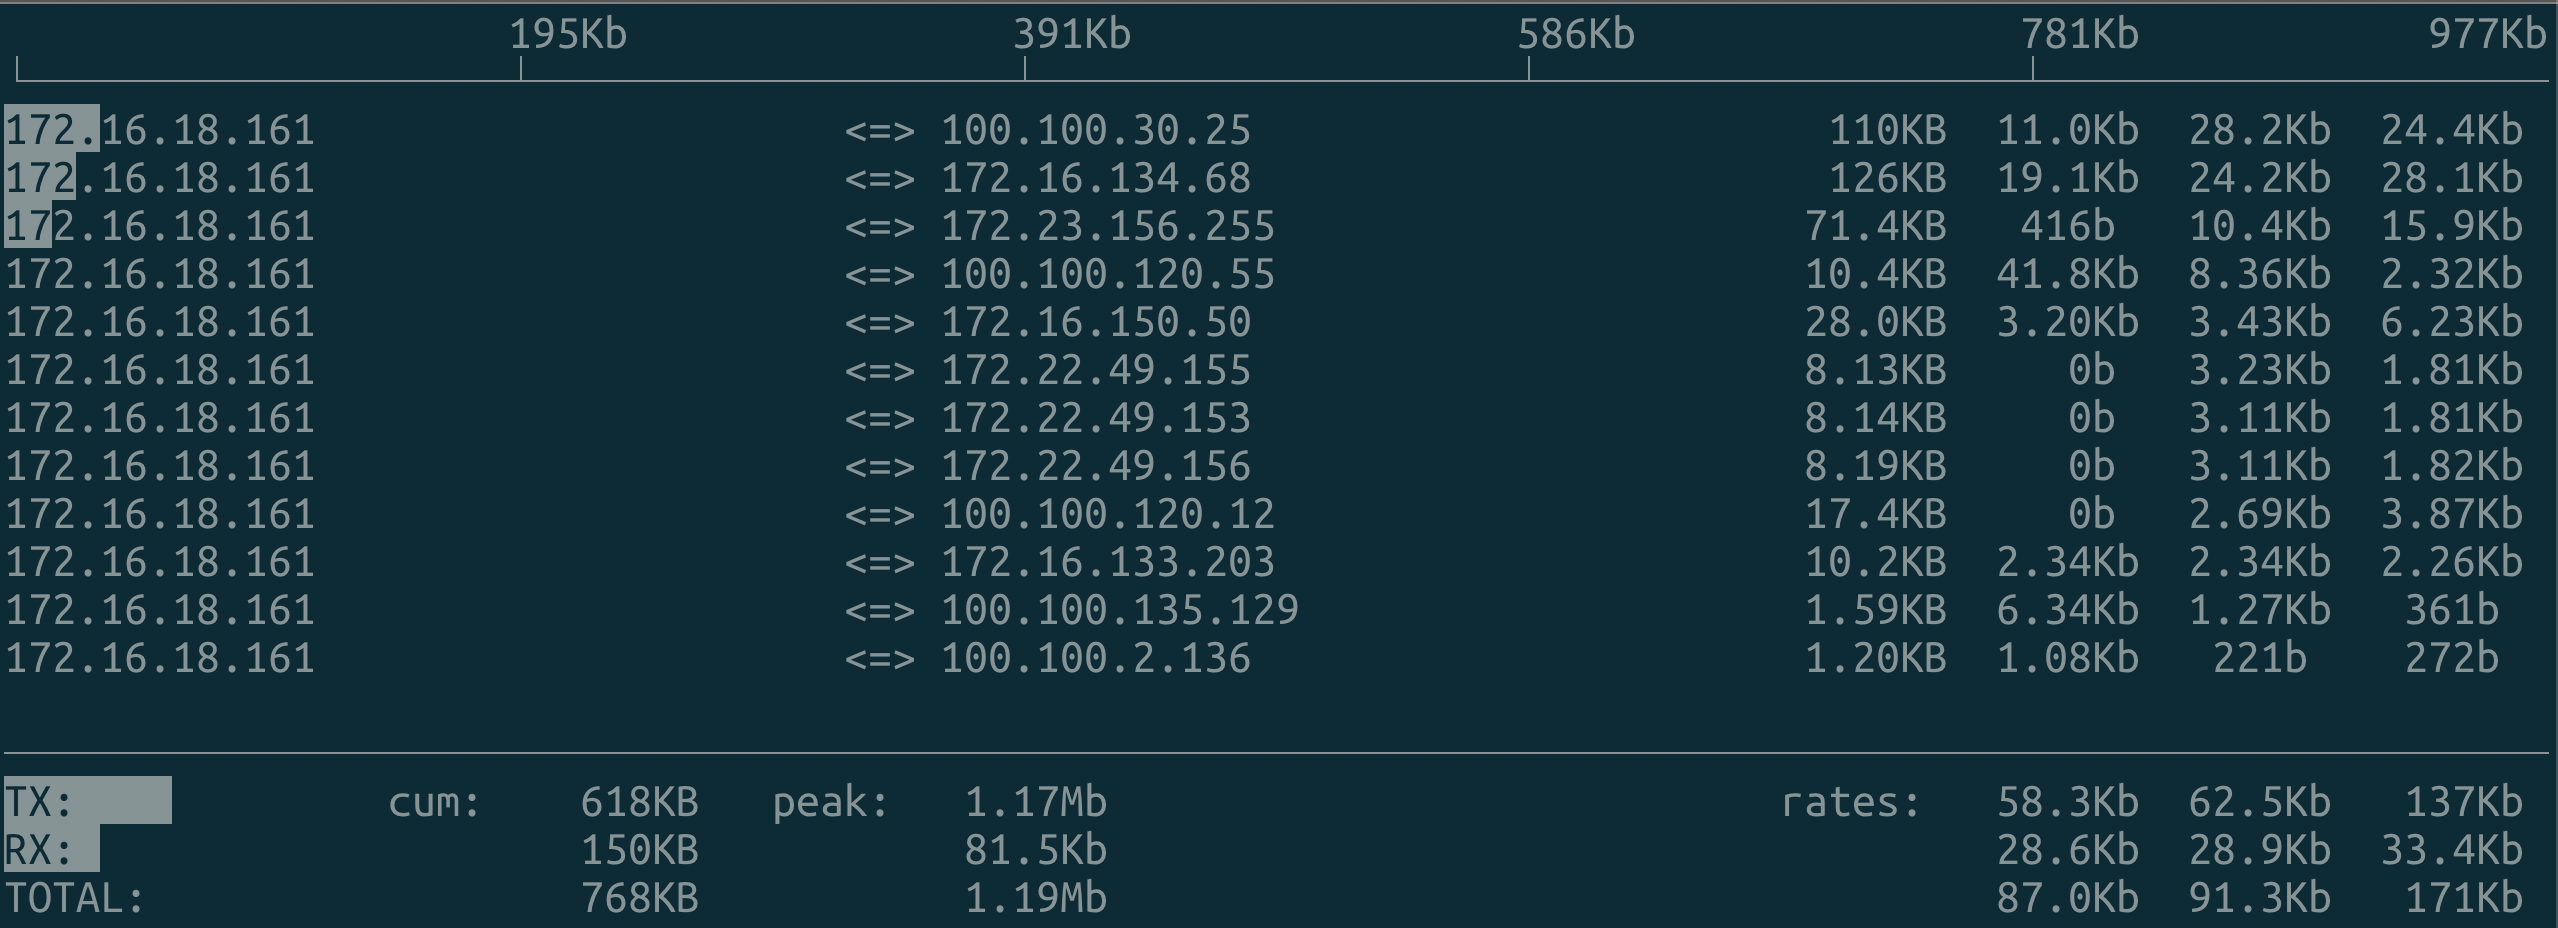
界面上方是流量的标尺,阴影的地方表示当前流量对在标尺上的位置。 <==> 表示是双向流量(在iftop 运行界面中连续输入两次 t)。
界面说明:
TX:发送流量
RX:接收流量
TOTAL:总流量
Cumm:运行 iftop 到目前时间的总流量
peak:流量峰值
rates:分别表示过去 2s 10s 40s 的平均流量
2.3 Iftop 命令行参数
 1
 2
 3
 4
 5
 6
 7
 8
 9
10
11
12
13
14
15
16
17
18
19
20
21
22
23
24
25
26
27
28
29
30
31
32
33
34
35
|
# iftop -h
iftop: display bandwidth usage on an interface by host

Synopsis: iftop -h | [-npblNBP] [-i interface] [-f filter code]
                               [-F net/mask] [-G net6/mask6]

   -h                  display this message
   -n                  don't do hostname lookups     # 常用
   -N                  don't convert port numbers to services # 常用
   -p                  run in promiscuous mode (show traffic between other  # 混杂模式,类似于嗅探器
                       hosts on the same network segment)
   -b                  don't display a bar graph of traffic
   -B                  display bandwidth in bytes   # 常用
   -a                  display bandwidth in packets
   -i interface        listen on named interface    #  网卡
   -f filter code      use filter code to select packets to count
                       (default: none, but only IP packets are counted) # 支持 tcpdump 风格过滤
   -F net/mask         show traffic flows in/out of IPv4 network
   -G net6/mask6       show traffic flows in/out of IPv6 network
   -l                  display and count link-local IPv6 traffic (default: off)
   -P                  show ports as well as hosts
   -m limit            sets the upper limit for the bandwidth scale  # 设置带宽的最大刻度如  iftop -m 100M
   -c config file      specifies an alternative configuration file
   -t                  use text interface without ncurses

   Sorting orders:
   -o 2s                Sort by first column (2s traffic average)
   -o 10s               Sort by second column (10s traffic average) [default]
   -o 40s               Sort by third column (40s traffic average)
   -o source            Sort by source address
   -o destination       Sort by destination address

   The following options are only available in combination with -t
   -s num              print one single text output afer num seconds, then quit
   -L num              number of lines to print
|
如果需要把特定流量导出到日志文件供后续分析可以配合 -t 参数使用。
 1
 2
 3
 4
 5
 6
 7
 8
 9
10
11
12
13
14
15
16
17
18
19
20
21
22
23
24
25
|
# iftop -n -t -s 5 -L 5   // -s 5 5s 后退出, -L 5 只打印最大的 5 行
interface: eth0
IP address is: 172.16.18.161
MAC address is: 00:16:3e:12:32:fd
Listening on eth0
   # Host name (port/service if enabled)            last 2s   last 10s   last 40s cumulative
--------------------------------------------------------------------------------------------
   1 172.16.18.161                            =>     2.94Kb     1.83Kb     1.83Kb     1.38KB
     172.16.134.68                            <=     37.2Kb     23.0Kb     23.0Kb     17.3KB
   2 172.16.18.161                            =>     4.90Kb     16.1Kb     16.1Kb     12.1KB
     100.100.30.25                            <=       184b       245b       245b       184B
   3 172.16.18.161                            =>     37.5Kb     12.5Kb     12.5Kb     9.39KB
     100.100.120.55                           <=     4.41Kb     1.47Kb     1.47Kb     1.10KB
   4 172.16.18.161                            =>         0b     1.70Kb     1.70Kb     1.27KB
     100.100.120.58                           <=         0b       551b       551b       413B
   5 172.16.18.161                            =>     3.95Kb     1.32Kb     1.32Kb     0.99KB
     100.100.135.129                          <=     2.39Kb       816b       816b       612B
--------------------------------------------------------------------------------------------
Total send rate:                                     51.9Kb     35.3Kb     35.3Kb
Total receive rate:                                  47.9Kb     28.3Kb     28.3Kb
Total send and receive rate:                         99.8Kb     63.6Kb     63.6Kb
--------------------------------------------------------------------------------------------
Peak rate (sent/received/total):                     51.9Kb     47.9Kb     99.8Kb
Cumulative (sent/received/total):                    26.5KB     21.2KB     47.7KB
============================================================================================
|
2.4 iftop 交互命令
在 iftop 运行主界面,可以进行交互体验,交互如下:
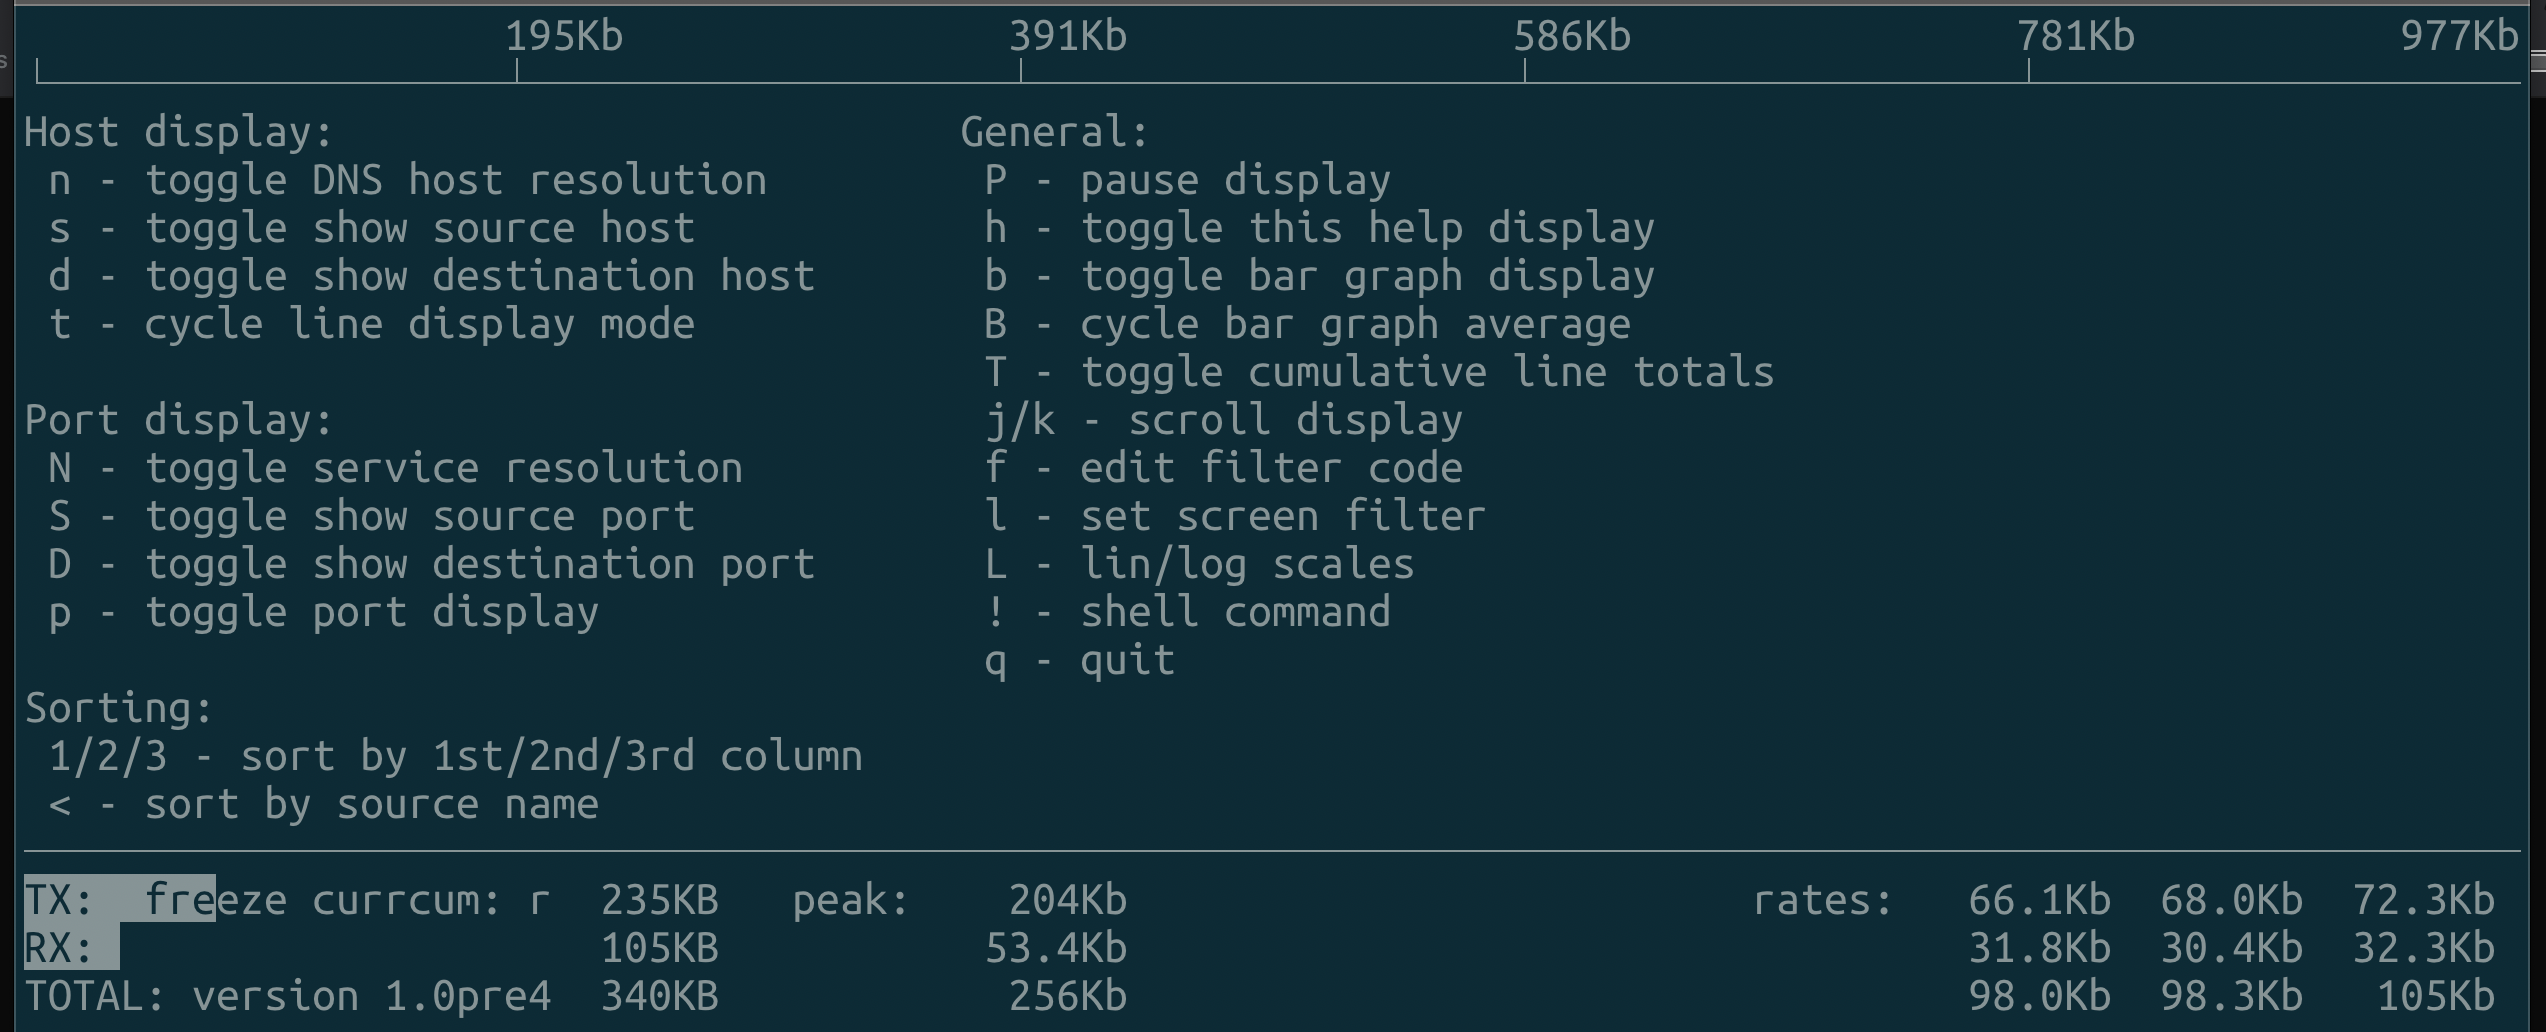
常用的交互键有以下几个:
1
2
3
4
5
|
t  流量两行显示,还是单行显示(<==> 这种模式)
N  关闭服务端口解析
p  显示或者隐藏端口
l  设置屏幕过滤
T  显示累加值
|
2.5 iftop 实现原理
3. SLB 异常流量分析
由于我们的 SLB 流量抖动时间不固定,因此我们需要通过定时采集的方式来进行流量记录,然后结合 SLB 的流量时间点进行分析。
 1
 2
 3
 4
 5
 6
 7
 8
 9
10
11
12
13
14
15
16
17
18
19
20
21
|
// -P 显示统计中的流量端口,-o 40s 按照近 40s 排序
# iftop -nNB -P -f "tcp port 6443" -t -s 60 -L 100 -o 40s
iftop -nNB -P  -f "tcp port 6443" -t -s  5 -L 100
interface: eth0
IP address is: 172.16.18.161
MAC address is: 00:16:3e:12:32:fd
Listening on eth0
   # Host name (port/service if enabled)            last 2s   last 10s   last 40s(排序) cumulative
--------------------------------------------------------------------------------------------
   1 172.16.18.161:48118                      =>       177B       161B       161B       968B
     172.16.134.68:6443                       <=     2.25KB     2.07KB     2.07KB     12.4KB
   2 172.16.18.161:47894                      =>         0B        44B        44B       264B
     172.16.134.68:6443                       <=         0B        48B        48B       287B
--------------------------------------------------------------------------------------------
Total send rate:                                       177B       205B       205B
Total receive rate:                                  2.25KB     2.11KB     2.11KB
Total send and receive rate:                         2.42KB     2.32KB     2.32KB
--------------------------------------------------------------------------------------------
Peak rate (sent/received/total):                       262B     2.25KB     2.42KB
Cumulative (sent/received/total):                    1.20KB     12.7KB     13.9KB
============================================================================================
|
通过 iftop 的定时分析流量结果,我们发现在 SLB 流量高峰出现丢包的时候,数据都是发送到 kube-proxy 进程,由于集群规模大概 1000 台左右,在集群 Pod 出现集中调度的时候,会出现大量的同步事件,那么与 kube-proxy 同步的信息是什么呢?通过阅读 kube-proxy 的源码,得知 kube-proxy 进程只会从 kube-apiserver 上同步 service 和 endpoint 对象。
 1
 2
 3
 4
 5
 6
 7
 8
 9
10
11
12
13
14
15
16
17
18
19
20
21
22
23
|
// Run runs the specified ProxyServer.  This should never exit (unless CleanupAndExit is set).
func (s *ProxyServer) Run() error {
	// ...


     // 监听 service 第一次同步结果,待 service 和 endpoint 都同步成功后,调用 proxier.syncProxyRules
	   go serviceConfig.Run(wait.NeverStop)

     // 监听 Endpoints 第一次同步结果,待 service 和 endpoint 都同步成功后,调用 proxier.syncProxyRules
	   go endpointsConfig.Run(wait.NeverStop)

		 // This has to start after the calls to NewServiceConfig and NewEndpointsConfig because those
	   // functions must configure their shared informer event handlers first.
     // 启动 informer 监听相关事件从 API Server的运行,包括 service 和 endpoint 事件的变化
	   go informerFactory.Start(wait.NeverStop)

	   // Birth Cry after the birth is successful
	   s.birthCry()

	    // Just loop forever for now...
	    s.Proxier.SyncLoop()  // iptables.NewProxier().SyncLoop()
	    return nil
}
|
在我们集群中的 Service 对象基本固定,那么在高峰流量期同步的必然是 endpoint 对象。
SLB 高峰流量时间点正好是我们一个离线服务 A 从混部集群中重新调度的时间,而该服务的副本大概有 1000 多个。同时通过分析生产环境的 service 的详情发现,由于监控的需要的,我们会在集群部署的每个服务上导出了一个额外的 Service 对象协助 Prometheus 来进行 Pod 发现(也包括在集群中部署的 DaemonSet 服务),结构如下:
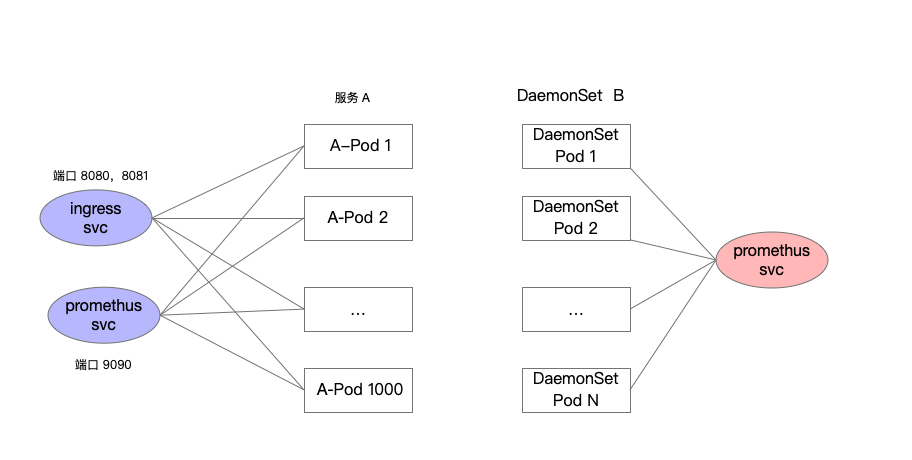
通过上述分析我们可以得知,因为集群中的多个 service 通过不同端口关联到了同一个 Pod,那么一个 Pod 销毁或创建触发的endpoint 对象更新会被放大(endpoint 是 service 与 pod 建立关联的中介对象)。
服务 A 副本在 1000 个左右,集群规模在 1000 台左右,那么服务 A 需要跨集群重新调度的时候(即使通过了平滑调度处理)由于批量 Pod 的频繁创建和销毁, endpoint 的状态更新流量会变得非常大,从而导致 SLB 的流量超过带宽限制,导致流量丢失。
同时由于 DaemonSet 对象也通过 Service 资源导出,用于监控服务发现,在 DaemonSet 服务发布的时候,也会面临 Endpoint 对象更新状态大量同步至 kube-proxy 的情况,导致 SLB 流量陡增。
问题排查清楚以后,那么解决的方式也比较简单:
- 对于副本大的服务 A 和 DeamonSet 服务取消用于监控的 Service 对象,同时对于副本较大的服务如果不需要 Ingress Service 也同步取消。
通过上述动作以后,集群 Master 节点前面的 SLB 的流量降低到最高 0.5 Gbps。
备注:在集群规模大的,Service 对象的过多,也可能导致 ipvs 的条目增多,从而因此 ipvs 模块的 estimation_timer 遍历时间过长,占用网络处理时间,导致网络延迟,可参见:https://www.infoq.cn/article/jmcbka0xx9nqrcx6loio 中的案例 2,当然这是我们排查的另外一个问题。如果服务设置了 NodePort,可以通过设置 kube-proxy 参数中的 –nodeport-addresses 参数设定网卡子网,避免 NodePort 在本地的所有网卡上绑定(比如 127.0.0.1 或者 docker0 169.xxx.xxx.xxx)
4. iftop 和 tcptop 性能对比
4.1 iftop
考虑到 libpcap 的获取包的性能,决定采用 iperf 工具进行压测,同时搜集一下 iftop 的性能数据,类似的网络测试工具还有 netperf 。
1
2
3
4
|
$ sudo yum install iperf3 -y

# 启动服务端,将 iperf3 服务端绑定在 15 核
$ taskset -c 15 iperf3 -s
|
Client 测试,为了验证资源的情况我们把 iperf3 的客户端测试绑定在核 14 上。
1
2
3
4
5
|
$ taskset -c 14 iperf3 -c 127.0.0.1 -t 120

[ ID] Interval           Transfer     Bandwidth       Retr
[  4]   0.00-120.00 sec   288 GBytes  20.6 Gbits/sec   53             sender
[  4]   0.00-120.00 sec   288 GBytes  20.6 Gbits/sec                  receiver
|
通过 Top 命令分析 CPU 占用,占用 CPU 大概 70% 左右。
1
2
3
4
5
6
7
8
9
|
$ top -p `pidof iftop`
top - 14:50:49 up 12 days, 23:40,  4 users,  load average: 1.97, 1.19, 0.73
Tasks:   1 total,   0 running,   1 sleeping,   0 stopped,   0 zombie
%Cpu(s):  1.4 us,  9.6 sy,  0.0 ni, 86.8 id,  0.1 wa,  0.0 hi,  2.1 si,  0.0 st
KiB Mem : 65806516 total, 57069916 free,  1469748 used,  7266852 buff/cache
KiB Swap:        0 total,        0 free,        0 used. 63718576 avail Mem

  PID USER      PR  NI    VIRT    RES    SHR S  %CPU %MEM     TIME+ COMMAND
19721 root      20   0  349092   5292   3436 S  66.8  0.0   0:59.21 iftop
|
pidstat 分析 iftop 程序的 CPU 的消耗,发现主要在 %system ,大概 50%,%user 大概 20%。 在 16C 的系统中,占用掉一个核,占用资源不到 5%,生产环境也是可以接受。
 1
 2
 3
 4
 5
 6
 7
 8
 9
10
11
12
13
14
15
16
17
18
|
# pidstat -p `pidof iftop` 1
Linux 3.10.0-1062.9.1.el7.x86_64 (bje-qtt-backend-paas-05) 	12/01/2020 	_x86_64_	(16 CPU)

02:51:21 PM   UID       PID    %usr %system  %guest    %CPU   CPU  Command
02:51:22 PM     0     19721    0.00    0.00    0.00    0.00    10  iftop
02:51:23 PM     0     19721    0.00    0.00    0.00    0.00    10  iftop
02:51:24 PM     0     19721    0.00    0.00    0.00    0.00    14  iftop
02:51:25 PM     0     19721   21.00   51.00    0.00   72.00    14  iftop
02:51:26 PM     0     19721   20.00   51.00    0.00   71.00     2  iftop
02:51:27 PM     0     19721   12.00   60.00    0.00   72.00    10  iftop
02:51:28 PM     0     19721   16.00   54.00    0.00   70.00    14  iftop
02:51:29 PM     0     19721   17.00   55.00    0.00   72.00     0  iftop
02:51:30 PM     0     19721   13.00   56.00    0.00   69.00     2  iftop
02:51:31 PM     0     19721   14.00   56.00    0.00   70.00     2  iftop
02:51:32 PM     0     19721   18.00   53.00    0.00   71.00     2  iftop
02:51:33 PM     0     19721   15.00   53.00    0.00   68.00     4  iftop
02:51:34 PM     0     19721   14.00   57.00    0.00   71.00     6  iftop
02:51:35 PM     0     19721   19.00   50.00    0.00   69.00     8  iftop
|
4.2 BPF BCC tcptop
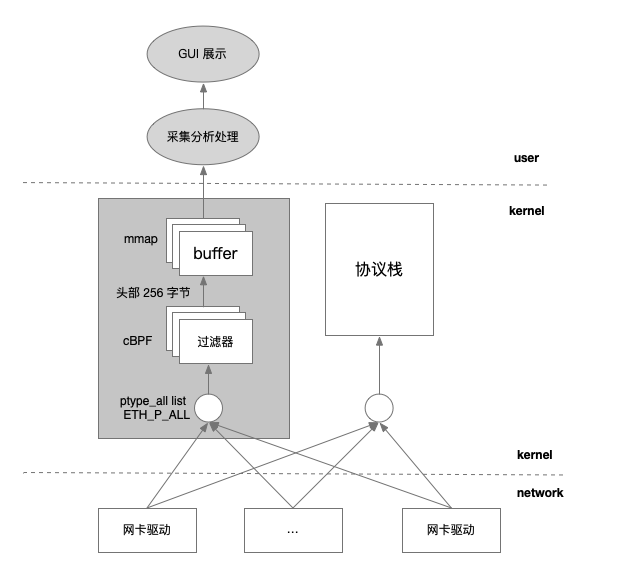
在 BPF 开源项目 BCC 中也有一个基于 BPF 技术的 TCP 流量统计工具,称作 tcptop,在内核中进行数据汇总,定期同步汇总数据至用户空间,避免了每个数据包从内核传递到用户空间(iftop 中为 256个头部字节)。安装基于 eBPF 版本的 tcptop,进行相关性能测试:
1
2
|
# yum install bcc -y
# /usr/share/bcc/tools/tcptop 10   # 每 10s 刷新一次
|
在 iperf 压测过程中,观测 tcptop 的 CPU 使用情况, %user %system 基本上都为 0, 考虑到把数据统计和分析的功能转移到了内核空间的 BPF 程序中,用户空间只是定期负责收集汇总的数据,从整体性能上来讲会比使用 libpcap 库(底层采用 cBPF)采集协议头数据(256字节)通过 mmap 映射内存的方式传递到用户态分析性能更加高效。
 1
 2
 3
 4
 5
 6
 7
 8
 9
10
11
12
13
|
# pidstat -p 11264  1
Linux 3.10.0-1062.9.1.el7.x86_64 	12/01/2020 	_x86_64_	(16 CPU)

04:17:33 PM   UID       PID    %usr %system  %guest    %CPU   CPU  Command
04:17:34 PM     0     11264    0.00    0.00    0.00    0.00    14  tcptop
04:17:35 PM     0     11264    0.00    0.00    0.00    0.00    14  tcptop
04:17:36 PM     0     11264    0.00    0.00    0.00    0.00    14  tcptop
04:17:37 PM     0     11264    0.00    0.00    0.00    0.00    14  tcptop
04:17:38 PM     0     11264    0.00    0.00    0.00    0.00    14  tcptop
04:17:39 PM     0     11264    0.00    0.00    0.00    0.00    14  tcptop
04:17:40 PM     0     11264    0.00    0.00    0.00    0.00    14  tcptop
04:17:41 PM     0     11264    0.00    0.00    0.00    0.00    14  tcptop
04:17:42 PM     0     11264    0.00    0.00    0.00    0.00    14  tcptop
|
bcc tcptop 的场景下,top 抽样:
1
2
3
4
5
6
7
8
9
|
top - 16:11:42 up 13 days,  1:01,  4 users,  load average: 1.01, 1.44, 1.40
Tasks: 263 total,   3 running, 260 sleeping,   0 stopped,   0 zombie
%Cpu(s):  0.7 us, 10.0 sy,  0.0 ni, 87.3 id,  0.1 wa,  0.0 hi,  1.9 si,  0.0 st
KiB Mem : 65806516 total, 56985872 free,  1542504 used,  7278140 buff/cache
KiB Swap:        0 total,        0 free,        0 used. 63645360 avail Mem

  PID USER      PR  NI    VIRT    RES    SHR S  %CPU %MEM     TIME+ COMMAND
31356 root      20   0    9744    844    732 R 100.0  0.0   0:19.12 iperf3
11519 root      20   0    9744   1024    876 R  96.7  0.0  24:46.13 iperf3
|
iftop 的场景下,top 抽样:
 1
 2
 3
 4
 5
 6
 7
 8
 9
10
|
top - 16:14:43 up 13 days,  1:04,  4 users,  load average: 0.93, 1.37, 1.39
Tasks: 266 total,   3 running, 263 sleeping,   0 stopped,   0 zombie
%Cpu(s):  0.8 us, 10.5 sy,  0.0 ni, 86.6 id,  0.1 wa,  0.0 hi,  2.0 si,  0.0 st
KiB Mem : 65806516 total, 57052332 free,  1470336 used,  7283848 buff/cache
KiB Swap:        0 total,        0 free,        0 used. 63717608 avail Mem

  PID USER      PR  NI    VIRT    RES    SHR S  %CPU %MEM     TIME+ COMMAND
 5809 root      20   0    9744    840    728 R 100.0  0.0   0:09.75 iperf3
11519 root      20   0    9744   1024    876 R  83.7  0.0  26:31.89 iperf3
 5782 root      20   0  349092   7420   3436 S  74.1  0.0   0:07.23 iftop
|
在下一篇文章我们会对基于 BPF 技术进行 tcp 流量分析的工具 tcptop 进行原理分析。
5. 参考